The relentless noise of the crude oil market often makes it feel like price action is driven by nothing more than chaotic headlines and unpredictable geopolitical shifts. When you are building an oil Elliott Wave forecast, the constant friction between OPEC news and demand data can make identifying a clear trend feel impossible. It’s common to feel that the market is moving against your position for no logical reason. If you’ve struggled to distinguish a temporary correction from a genuine trend reversal, you’ve experienced the primary challenge of trading energy. Most traders find themselves stopped out by “noisy” price action because they lack a structural framework to organize the chaos.
Our analysis for 2026 provides that necessary framework. By mapping the current cycle through the lens of wave theory, we can identify high-probability trade setups and long-term price targets that remain invisible to the naked eye. This article offers a clear roadmap for the year ahead. We will break down specific wave counts to help you validate your own analysis and establish a reliable method for timing entries. Understanding these fractal cycles allows you to trade with the calm confidence of a professional who sees the pattern behind the volatility.
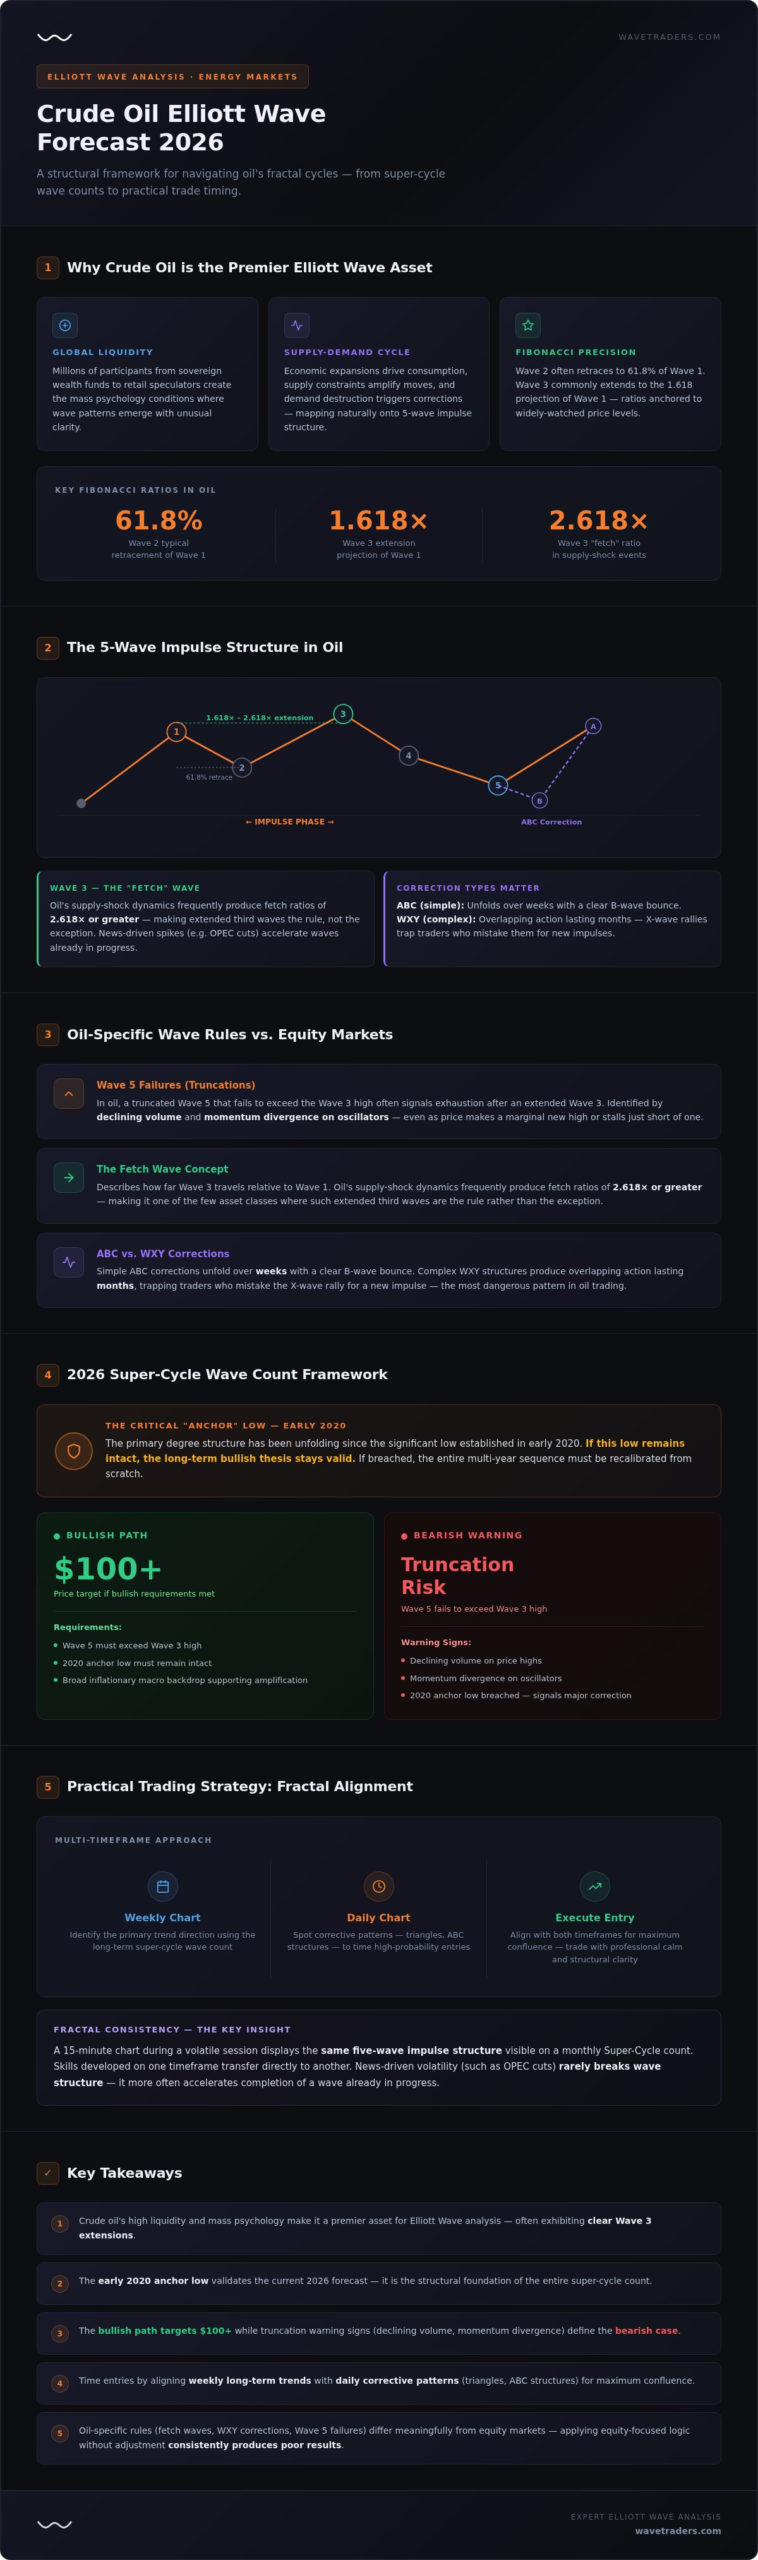
Few markets exhibit wave structure as cleanly as crude oil. The combination of enormous global liquidity, a clearly defined supply-demand cycle, and the mass psychology of millions of participants ranging from sovereign wealth funds to retail speculators creates the precise conditions where Elliott Wave patterns emerge with unusual clarity. When you’re building an oil Elliott Wave forecast, you’re working with an asset that essentially wants to trend, correct, and trend again in recognizable, repeating sequences.
Energy demand is itself cyclical by nature. Economic expansions drive industrial consumption higher, supply constraints amplify the move, and eventual demand destruction triggers the corrective phase. This fundamental rhythm maps almost instinctively onto the five-wave impulse and three-wave corrective structure that Ralph Nelson Elliott described. The market’s underlying mechanics reinforce the pattern rather than working against it.
Fibonacci ratios also tend to hold with notable precision in oil. Wave 2 corrections frequently retrace to the 61.8% level of Wave 1, while Wave 3 extensions commonly reach the 1.618 projection of Wave 1. These aren’t coincidences; they reflect the collective decision-making of a market where position sizing, stop placement, and profit targets are often anchored to the same widely-watched price levels.
One of the most useful properties of oil price action is its fractal consistency. A 15-minute chart during a volatile session can display the same five-wave impulse structure visible on a monthly Super-Cycle count. This self-similarity means the analytical skills you develop on one timeframe transfer directly to another. It’s also why news-driven volatility, such as a surprise OPEC production cut, rarely breaks the wave structure. More often, the headline simply accelerates the completion of a wave that was already in progress. A Commodity Wave is best understood as a high-momentum impulse driven by supply-side shocks that compresses what might otherwise be a gradual move into a sharp, extended thrust.
Oil exhibits several wave behaviors that differ meaningfully from equities. Understanding them is essential for accurate counts:
Recognizing these commodity-specific patterns is what separates a reliable count from a guess. The structural rules don’t change, but their expression in oil is distinct enough that applying equity-focused wave logic without adjustment will consistently produce poor results.
To understand the 2026 oil Elliott Wave forecast, we have to look beyond the immediate price action. Market cycles don’t exist in isolation; they’re part of a Primary Degree structure that has been unfolding since the significant “anchor” low established in early 2020. That historical price level serves as the vital foundation for our current count. If that low remains intact, the long-term bullish thesis for the energy sector stays valid. If it’s eventually breached, we’d have to recalibrate the entire multi-year sequence from scratch.
We apply a similar 1235 wave cycle logic here as we do in our gold Elliott Wave analysis. Just as precious metals respond to shifts in global liquidity, crude oil’s sub-wave structure currently reflects broader inflationary trends. These macro forces don’t change the fundamental wave rules, but they do influence their amplitude and duration. We’re seeing this play out in the extended nature of recent impulsive moves, where price targets are being pushed toward the upper boundaries of Fibonacci projections.
The long-term trend from the 2020 lows suggests we’re navigating a massive five-wave sequence. As we move into 2026, the primary question is whether the Wave 4 correction has fully completed its complex pattern. Wave 4s are notoriously difficult because they often take the form of sideways triangles or deep zig-zags that test a trader’s patience. The 2026 pivot point will likely define the energy sector’s direction for the remainder of the decade. A successful hold above key support levels would signal that the final Wave 5 thrust toward new highs is ready to begin.
Zooming into the daily and weekly charts allows us to identify the sub-waves that offer actual tradeable opportunities. We often look for correlations with other hard assets, using silver Elliott Wave analysis to gauge overall commodity sentiment. When silver and oil begin to move in structural alignment, it often marks the “Point of Recognition.” This is the moment when the broader market realizes a new trend is underway, leading to a surge in volume and momentum. If you want to master the art of identifying these setups before they become obvious, our Elliott Wave School provides the structured curriculum needed to trade with professional precision.
By tracking these intermediate degrees, we can see the internal development of the 2026 cycle. We aren’t just looking at price; we’re looking at the maturity of the pattern. A completed three-wave correction on the daily chart, followed by a clear five-wave impulsive turn, gives us the confirmation needed to project the next major price target with confidence.
Every professional oil Elliott Wave forecast must account for multiple paths. We don’t trade based on a single prediction but rather on the validation of specific structural requirements. A key tool in our arsenal is the Rule of Alternation. This principle suggests that if the previous correction (Wave 2) was sharp and deep, the current or upcoming correction (Wave 4) will likely be complex and sideways, such as a triangle or a flat. By observing the character of past waves, we can predict the likely depth and duration of the next correction with much higher accuracy.
Setting clear invalidation levels is what separates professional analysis from guesswork. We don’t wait for a major price collapse to realize a count is wrong. Instead, we identify the specific price point where the wave structure violates a core rule of the Elliott Wave Principle. This disciplined approach ensures that we can pivot quickly when the market provides new information, keeping risk managed even in the volatile energy sector.
In our primary bullish count, we’re tracking a powerful Wave 3 extension that targets the $100+ level. This projection is anchored to the 1.618 Fibonacci extension of Wave 1, measured from the Wave 2 bottom. For this scenario to remain the lead count through 2026, crude oil must hold above established support zones, specifically the price territory of the previous Wave 4 of a lesser degree. To find these specific price coordinates with precision, we often adapt the logic found in our Elliott Wave calculator for forex to the commodity markets. If price remains above these critical levels, the path toward triple digits remains the most probable outcome.
The primary bearish risk for 2026 involves the development of an expanded flat correction or a truncated Wave 5. An expanded flat is particularly deceptive because the B-wave often exceeds the start of the preceding impulse, creating a “trap” that lures in buyers before a sharp C-wave sell-off begins. If we see price stall near previous highs with clear momentum divergence on the daily charts, it suggests the final impulse wave has truncated. In this scenario, we’d target a deep correction toward the 0.618 retracement of the entire multi-year sequence. Protecting capital in this environment requires exiting when the primary count is invalidated, rather than hoping for a recovery that the wave structure no longer supports.
Executing a professional oil Elliott Wave forecast requires moving from theory to practice with a disciplined entry and exit protocol. We don’t just look for a pattern; we look for a setup that offers a clear mathematical advantage. By following a structured five-step process, you can strip away the emotional noise of the energy markets and focus on the high-probability cycles that define crude oil’s price action.
Applying Elliott Wave risk management to the oil market is vital because energy prices are prone to sharp “gaps” and supply shocks. Position sizing is more critical here than in major forex pairs because the percentage moves in oil can be significantly larger over a shorter period. We treat these gaps as part of the wave structure; often, a weekend gap simply completes a Wave 3 or Wave 5 thrust that was already in progress. Never over-leverage a commodity position, even when the wave count looks “perfect.”
The precision of the 2026 oil forecast is an ideal tool for those participating in prop firm challenges. High-conviction wave setups allow you to meet profit targets while respecting strict daily drawdown limits. By focusing only on the “Point of Recognition” in Wave 3, you can leverage the market’s strongest momentum. Using a professional methodology for funded trader programs provides the structural consistency that discretionary “gut feel” trading lacks. If you want to refine your execution, join our FX and Commodity Service for daily chart updates and real-time wave counts.
A static oil Elliott Wave forecast serves as a vital strategic map, but the 2026 energy market will require more than just a fixed perspective. Real-time updates are essential because market conditions can shift the sub-wave structure within hours. Our FX Service, which includes comprehensive commodity coverage, provides the agility needed to adjust your counts as new price data arrives. Members receive daily chart updates and video analysis that walk through the logic of every wave count, ensuring you’re never left guessing about the current market phase.
We don’t believe in “black box” signals that keep you dependent on a service. Instead, our goal is to help you transition from a signal-follower to a market-mapper. By using our proprietary charts and the Elliott Wave Calculator, you can apply the same precision to your own analysis that we use in our daily reports. This methodical approach builds the quiet confidence required to hold positions through the inevitable volatility of a Wave 4 correction or a complex sideways flat.
Our commitment to teaching the “why” behind every count is what sets us apart. We provide video lessons that break down the 2026 energy forecast step-by-step, showing you exactly how we identify anchor lows and Fibonacci clusters. When you join our community, you aren’t just getting data; you’re joining a group of professional analysts and funded traders who track these cycles together. This shared pursuit of market mastery makes the learning process more effective and keeps you anchored in a reliable methodology rather than reactive trading.
Mastering the crude oil cycle is a journey of pattern recognition and emotional discipline. You can start by exploring our free charts and educational resources to get a feel for our analytical style. For those ready to go deeper, the Elliott Wave School offers a structured curriculum designed to take you from the basics to professional-level proficiency. Whether you’re looking to pass a prop firm challenge through our Funded Trader Program or simply manage your own capital with more precision, we have the tools to support your growth.
Join Wavetraders and trade the 2026 oil cycle with confidence.
The 2026 oil market will likely be defined by its structural clarity rather than its headline-driven chaos. By recognizing that crude oil acts as a textbook asset for wave theory, you can move past the noise and focus on the fractal patterns that repeat across every timeframe. This oil Elliott Wave forecast provides the essential roadmap, but consistent results come from the daily application of these principles. Whether you’re tracking the primary super-cycle or zooming into tradeable sub-waves, the key is to stay disciplined and respect your invalidation levels.
Wavetraders provides the expertise needed to turn these observations into actionable plans. With founder-led analysis backed by over 20 years of market experience, we offer real-time commodity updates and detailed video lessons that explain the logic behind every count. Our comprehensive Elliott Wave School curriculum is designed to help you master the methodology yourself, ensuring you can navigate any market environment with professional poise. It’s time to stop guessing and start trading with a clear, structural framework.
Master the Oil Market: Apply for Wavetraders Membership Today
We look forward to tracking these cycles together and supporting your growth as a professional trader in the energy sector.
The current wave count for WTI Crude Oil in 2026 suggests the market is finishing a complex Primary Wave 4 correction and preparing for a final Wave 5 impulse. This structural view is based on the multi-year cycle that began at the 2020 lows. While short-term volatility persists, the larger pattern remains intact as long as key support levels hold. Tracking these internal sub-waves helps traders identify the precise moment the trend resumes.
Elliott Wave is often more accurate for timing than fundamentals because it tracks the mass psychology that drives price action before news breaks. Fundamental data like OPEC production cuts or demand shifts usually act as catalysts that complete existing wave patterns rather than creating new ones. By using an oil Elliott Wave forecast, you can see the structural maturity of a trend, which fundamental analysis alone often misses during periods of extreme sentiment.
A top-down approach is the most effective method for analyzing the oil market. We recommend using the Weekly chart to establish the Primary cycle context and the Daily chart to identify corrective patterns like triangles or zig-zags. For actual trade execution and timing, the 4-hour chart provides the necessary detail to spot leading diagonals or impulsive 1-2 turns. This combination ensures your entries align with the higher-degree trend.
You can certainly use Elliott Wave to trade oil within a Funded Trader Program. The methodology is particularly useful for passing prop firm challenges because it provides clear invalidation levels to protect your account from excessive drawdowns. By focusing on high-conviction Wave 3 setups, you can meet profit targets with a disciplined risk-to-reward ratio. Many successful funded traders rely on this structural framework to maintain the consistency required by prop firm rules.
The primary Fibonacci levels for the 2026 forecast include the 61.8% retracement for corrective waves and the 1.618 extension for impulsive targets. Specifically, we look for Wave 4 to find support near the 38.2% or 50% retracement of the preceding Wave 3. If the market enters a bullish extension, the 1.618 and 2.618 projections from the initial Wave 1 are the most common areas for major price peaks to occur.
Handling an invalidation requires immediate action: you must close the position and step back to re-evaluate the count. An invalidation occurs when price violates a core rule, such as Wave 4 entering the price territory of Wave 1. Instead of forcing the old count to work, we look for alternative scenarios like a complex flat or a different degree of trend. This intellectual honesty is what keeps your capital safe during unexpected market shifts.
Wavetraders provides daily updates for the oil Elliott Wave forecast through our FX and Commodity Service. Members receive real-time chart analysis and video lessons that break down the latest price action across WTI and Brent. These updates ensure you’re always aware of shifts in the sub-wave structure. We also offer foundational training in our Elliott Wave School to help you interpret these updates and build your own professional-grade counts.
Brent and WTI Crude Oil counts generally follow the same Primary degree cycles, but their specific price levels and sub-wave extensions often differ. Brent frequently shows more extended fifth waves due to global supply dynamics, while WTI can exhibit cleaner Fibonacci retracements. We track both instruments to find the clearest pattern. When both charts confirm a similar wave structure, it increases the probability that the forecasted move will play out as expected.
DISCLAIMER
Any reviews, news, analysis, prices or other information contained on our website is provided as general market commentary and delivered electronically through a distribution channel to larger number of clients, therefore does not constitute investment advice or investment research. We are not trading advisors. Most of our work is for educational purposes only, with information based on Elliott Wave theory in real time. Trading forex, futures, options, stocks, cryptocurrenices or any another trading market carries a high level of risk, and may not be suitable for all investors.
The possibility exists that you could lose some or all of your initial investment; therefore you should not invest money that you cannot afford to lose. Our website and the information that we provide should not be relied upon as a substitute for extensive independent research before making your investment decisions. In no event will we be liable for any loss or damage on your account in connection with, the use of our products. For any real cash investments you have to contact your financial advisor.
Any information or material contained on our website is owned by Val Global d.o.o.. Reproduction is prohibited without Val Global d.o.o. prior license in writing.
By continuing to use the site, you agree to the use of cookies. Learn more.
The cookie settings on this website are set to "allow cookies" to give you the best browsing experience possible. If you continue to use this website without changing your cookie settings or you click "Accept" below then you are consenting to this.