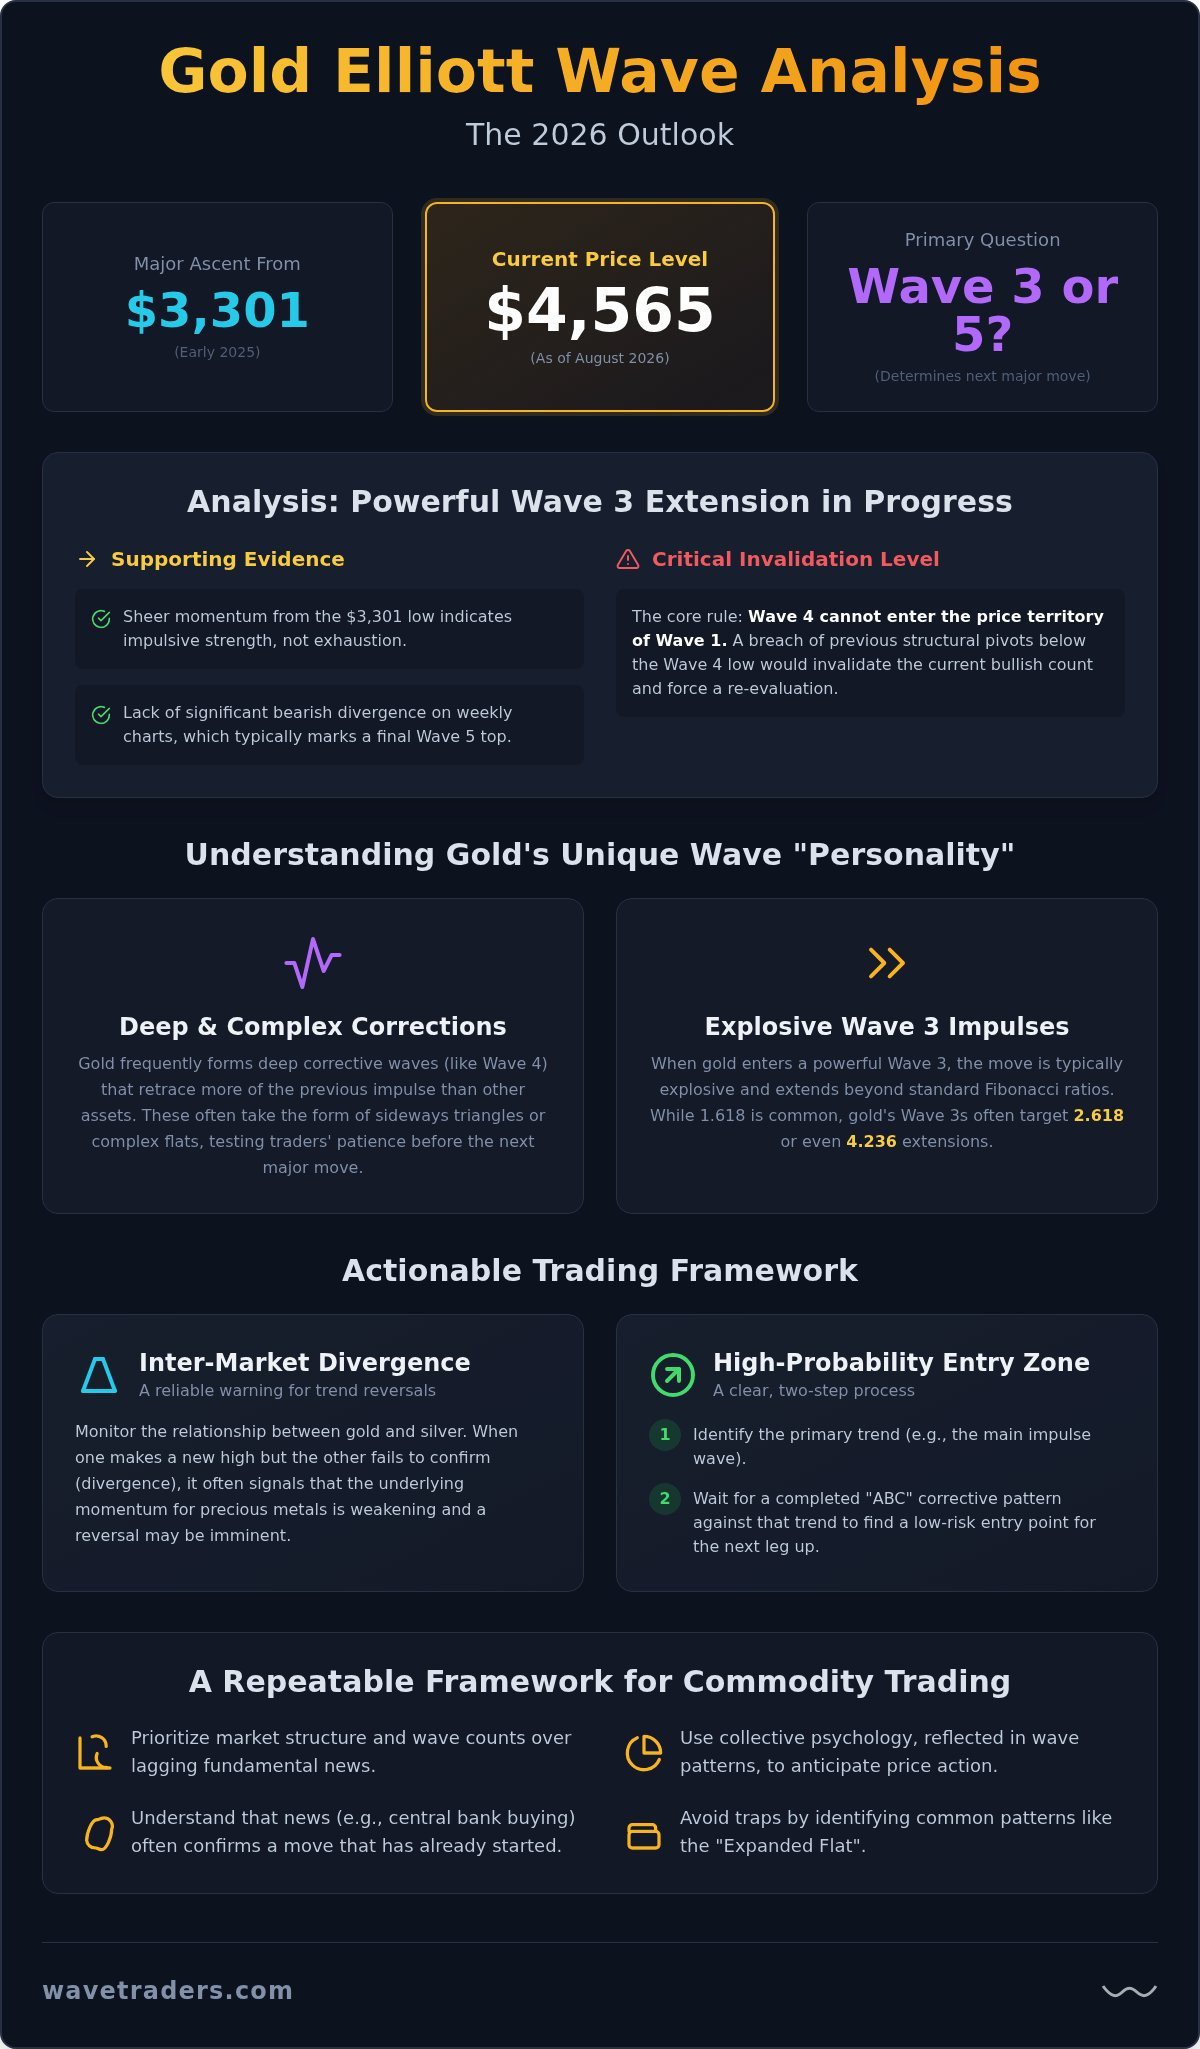
What if the sharp swings we’ve seen in the gold market lately aren’t random noise, but a precisely mapped sequence of collective psychology? For many traders, the climb toward the $4,565 level in August 2026 has been a minefield of liquidity hunts and deceptive corrective bounces. It’s easy to feel like you’re constantly one step behind the market, especially when you rely on lagging fundamental news that doesn’t seem to match the current price action. Mastering gold Elliott Wave analysis allows you to step back from the daily chaos and see the broader structure that many participants miss.
We understand the frustration of misidentifying a temporary rally as the start of a major new bull market only to be stopped out. This article will show you how Elliott Wave theory deciphers Gold’s complex price action to identify high-probability trend reversals and clear targets for the remainder of 2026. You’ll gain a repeatable strategy for commodity trading that explains the “why” behind these massive price swings. We’ll examine the current impulsive cycles and map out exactly where the precious metal appears to be heading as we move through this volatile cycle together.
Gold has a reputation for being erratic, but to a seasoned practitioner, its movements follow a distinct behavioral signature. While many traders struggle with the metal’s volatility, a disciplined gold Elliott Wave analysis reveals that these swings aren’t random noise. They’re the result of deep, complex corrective waves that often retrace more of the previous impulse than other assets. This characteristic is visible in the 2026 market, where the price has climbed toward $4,565.12 amidst intense global uncertainty. Understanding this “personality” is the first step toward trading it successfully. Gold tends to trap participants by extending its corrections, making it look like a trend has failed when it’s actually just building energy for the next move.
Traders often wait for fundamental news to confirm their bias, but news usually lags behind the structural reality. For example, record central bank purchases of 288.9 tonnes in Q2 2026 provided a bullish narrative, but the price had already begun its ascent months earlier. The Elliott Wave principle teaches us that price action reflects collective psychology long before it hits the headlines. Sentiment extremes often mark the peaks and troughs of these waves. In 2026, we’ve seen “safe haven” buying reach a fever pitch just as the market hits structural resistance. Defining the trough of a wave requires looking past the fear-driven headlines and focusing on whether the internal sub-waves have completed their requisite five-wave or three-wave structures.
One of gold’s most common traps is the Expanded Flat. In this pattern, Wave B breaks the start of Wave A, and Wave C breaks the end of Wave A, flushing out both bulls and bears before the true trend resumes. These are common in commodity markets where volatility is high. Applying a consistent gold Elliott Wave analysis helps distinguish these news-driven distribution phases from genuine structural shifts. When gold finally enters a Wave 3, the move is typically explosive. We’ve seen this throughout the 2026 cycle; Wave 3s in gold often extend beyond the standard 1.618 Fibonacci ratio, reaching for the 2.618 or even 4.236 levels. Identifying these structural pivots early allows you to ride the momentum rather than fighting against it. Using Fibonacci ratios to find these pivots provides a calm, methodical way to track the market’s progress.
To map the 2026 precious metal cycle, we must look beyond the immediate price action and focus on the primary degree. As of August 2026, gold sits near $4,565.12. This price level isn’t just a high number; it represents a specific point in a multi-year impulsive sequence that began its major ascent in early 2025. Most practitioners are currently debating whether we are witnessing the peak of a Wave 3 or the terminal stages of a Wave 5. Based on the lack of bearish divergence on the weekly charts and the sheer momentum of the rally from the $3,301 low, the evidence suggests we are still within a powerful Wave 3 extension. While USGS gold statistics help us understand the physical supply constraints and global demand trends, the gold Elliott Wave analysis focuses on the sentiment driving these impulsive moves. The inverse relationship with the Dollar Index (DXY) remains a key factor. A weakening DXY has acted as the fuel for these mid-cycle extensions, pushing gold toward its current all-time highs.
Looking closer at the 2026 trend, we can identify smaller sub-waves that dictate the daily rhythm. Corrective Wave 4 consolidations are often the most frustrating for traders because they take the form of sideways triangles or complex flats that test patience. Spotting the end of these pauses allows for high-probability entries before the next leg up begins. Gold in 2026 is currently progressing through the final sub-waves of an Intermediate degree Wave 3 impulse. Tracking these movements in real-time through the FX Service can help you stay aligned with the primary trend while managing the intraday noise.
Every wave count must have a clear point where the thesis is proven wrong. The most critical hard rule in impulsive structures is that Wave 4 cannot enter the price territory of Wave 1. For the current 2026 outlook, a breach of previous structural pivots would force a significant re-evaluation of the bullish count. Setting stop losses at these structural levels is much more effective than using arbitrary percentage-based stops that don’t account for market structure. Implementing proper Elliott Wave risk management ensures that even if a count fails, your capital remains protected for the next opportunity. This methodical approach removes the emotional pressure of trading in a high-volatility environment.
Many traders analyze gold in a vacuum, but the metal rarely moves alone. In the 2026 cycle, we’ve seen gold and silver travel in tandem, yet their velocities often differ based on where we are in the impulse. Typically, gold acts as the steady leader during the early stages of a bull market. Silver, being a smaller and more volatile market, often lags initially before staging an explosive “catch-up” rally. This relationship is vital for a comprehensive gold Elliott Wave analysis because it allows us to identify inter-market divergence. If gold pushes to a new nominal high while silver fails to break its own structural resistance, it suggests the move lacks broad-based participation. This divergence often acts as a leading indicator for a potential wave reversal.
Strategic allocation depends on recognizing these shifting leads. Data from the World Gold Council highlights how institutional demand often flows into gold first for stability before speculative interest spills over into silver. By tracking the wave structure of both metals, you can determine which asset offers the better risk-to-reward ratio at any given time. It isn’t just about picking the right direction; it’s about being in the right asset for the specific wave degree. The same structural discipline that applies to precious metals can be extended to energy markets, and traders who also follow an oil Elliott Wave forecast will recognize how inter-market commodity cycles often move in correlated sequences that reveal broader risk appetite shifts.
Silver’s count frequently provides the “missing piece” of the puzzle. While gold has been trending strongly toward $4,565.12, comparing its path to a detailed silver Elliott Wave analysis helps confirm the health of the trend. During a Wave 3 impulse, silver often exhibits higher beta, moving twice as fast as gold in percentage terms. If gold is in a clear third wave but silver remains stuck in a corrective consolidation, the breakout in gold might be a bull trap. Conversely, when silver finally clears its Wave 2 trough and starts its own impulsive advance, it confirms that the entire sector is in a sustainable bull phase.
We can apply the same analytical tools to the gold/silver ratio itself. As of August 21, 2026, the ratio stands at 66.3, which is slightly above the long-run average of 60.5 recorded since 1971. Treating this ratio as a tradable instrument allows us to forecast which metal will outperform. A five-wave impulsive decline in the ratio suggests silver will gain value faster than gold, which is a common occurrence during the “blow-off” phase of a cycle. Monitoring this ratio alongside your primary gold Elliott Wave analysis provides a multi-dimensional view of the market. It tells us whether the precious metals sector is healthy or if the rally is becoming dangerously top-heavy.
Applying a consistent gold Elliott Wave analysis isn’t just about drawing lines on a chart; it’s about executing trades with precision and patience. The first step in any successful strategy is to identify the primary trend direction on the daily and weekly timeframes. In the 2026 market, gold has displayed a clear impulsive character, which means your bias should remain bullish as long as the impulse remains intact. Once you’ve established the trend, the goal is to wait for a completed 3-wave correction, typically labeled as an ABC structure, that moves against that primary trend. Chasing a vertical move often leads to poor entries, whereas waiting for these corrective pullbacks allows you to enter at a more favorable risk-to-reward ratio.
After identifying a potential entry point, use Fibonacci extensions to project where the next impulsive leg might end. We typically look for Wave 3 or Wave 5 targets at key mathematical levels. To avoid “catching a falling knife” during a correction, confirm the turn with momentum oscillators like the RSI or MACD. These tools help signal when the selling pressure has exhausted itself. Finally, always execute with a clear invalidation level based on the wave count. If the price breaches a level that violates the core rules of the theory, you must step aside and re-evaluate your count without emotional attachment.
Precision in forecasting requires a methodical approach to data. By using the Elliott Wave forex calculator, you can input specific wave peaks and troughs to generate high-probability price targets. This tool is essential for calculating the 1.618 and 2.618 extensions that gold frequently hits during its most powerful impulsive moves. Fibonacci ratios provide the “DNA” for Gold’s price targets. These levels act as a roadmap, showing you where institutional profit-taking is likely to occur so you don’t get caught holding a position too long.
A wave trough represents the point of maximum pessimism before the trend resumes. Defining a trough accurately is the secret to high-probability long entries. One effective technique is the “Look Left” rule, which involves using previous wave structures as support or resistance zones. For example, the peak of a previous Wave 4 often becomes a support zone for a current corrective Wave 2 or 4. Distinguishing a minor pull-back from a major trend reversal becomes much easier when you can see the internal sub-waves completing their cycles. If you’re looking to refine your ability to spot these turns, you can access real-time updates and expert guidance through our FX Service.
Navigating the precious metals market requires more than just a passing familiarity with price patterns. It demands a commitment to understanding the underlying structure of the market. Our approach to gold Elliott Wave analysis at Wavetraders isn’t based on rigid predictions but on a dynamic interpretation of market cycles. By accessing the FX Service, you gain real-time updates on gold and other commodities, allowing you to see how wave counts evolve as new price data enters the market. We don’t just provide a static view; we provide a living analysis that adapts to the volatility of the 2026 cycle.
The Elliott Wave School serves as the foundation for this mastery. Many traders find the theory subjective or overwhelming at first. We address this by offering structured learning pathways designed for all experience levels. Our practitioner-teacher philosophy ensures that you’re learning from someone who is actively trading the same markets they’re teaching. This approach significantly reduces the learning curve, moving you away from confusion and toward a methodical, rules-based trading style. You’ll find that having a seasoned professional explain the “why” behind a wave count makes the methodology much more approachable.
Reading about wave theory in a textbook is quite different from applying it to a live chart of gold at $4,565.12. Following live charts is essential for mastering wave counting because it teaches you how to handle the “noise” that often obscures the primary trend. Seeing an expert analyst navigate the 2026 gold markets provides a template for your own decision-making. You’ll learn to identify the subtle differences between a corrective bounce and a new impulsive leg in real-time. Integrating Elliott Wave video lessons into your daily routine helps bridge the gap between theory and practical execution, turning abstract concepts into actionable trading plans.
The ultimate goal of our community is to move you from “signal following” to independent market analysis. While our real-time updates provide immediate value, the long-term benefit of a Wavetraders membership is the development of your own analytical eyes. Joining a community of like-minded technical analysts allows you to share observations and refine your counts in a collaborative environment. This collective intelligence is a powerful tool for navigating the complexities of commodity trading. It’s about achieving trading sovereignty where you can look at any chart and understand exactly what the market is communicating. Ready to track the 2026 Gold cycle? Apply for Wavetraders membership here to start your journey toward market mastery.
Success in the precious metals market isn’t about predicting the future with absolute certainty; it’s about identifying high-probability patterns and managing risk. We’ve explored how gold Elliott Wave analysis provides a structural map of the 2026 cycle, helping you distinguish between explosive impulsive moves and complex corrective traps. By understanding the unique personality of gold waves and monitoring the correlation with silver, you can move beyond the noise of lagging fundamentals and trade with a clear, repeatable strategy.
Wavetraders has provided expert analysis since 2003, offering a path for traders to achieve independent market sovereignty. Whether you’re looking for real-time commodity and FX coverage or a deep dive into our comprehensive Elliott Wave School curriculum, we’re here to track these markets together. Don’t let the volatility of the current cycle catch you off guard. It’s time to refine your technical edge and join a community of dedicated practitioners who value methodical, calm observation over market hype.
Join Wavetraders and Master Gold Elliott Wave Analysis in 2026. Let’s navigate these price swings with the composed voice of experience and the clarity of a proven methodology.
Elliott Wave analysis is highly reliable for gold because it tracks the collective psychology of market participants in a liquid asset. While no method offers absolute certainty, the theory provides a clear framework for identifying high-probability setups. Since gold often produces deep corrections, having a structural map helps traders stay calm during volatile swings. It involves recognizing patterns that repeat across multiple timeframes to manage risk and protect your capital effectively.
Identifying the start of a Wave 3 involves watching for a decisive break above the peak of Wave 1 after a completed Wave 2 correction. Wave 3 is typically the most explosive and extended part of the sequence. You’ll often see a surge in momentum as the price accelerates. In our gold Elliott Wave analysis, we look for these “point of recognition” moments where the trend becomes undeniable to the broader market participants.
The best approach is to use multiple timeframes to confirm the wave degree. We recommend starting with the weekly and daily charts to establish the primary trend and major wave count. Once the larger structure is clear, you can zoom into the 4-hour or 1-hour charts to identify sub-waves and precise entry zones. This top-down method ensures you aren’t fighting the primary trend while looking for tactical, short-term trading opportunities.
Yes, gold can be analyzed effectively during high-inflation periods because the theory tracks how participants react to economic data. Inflationary pressures often fuel the sentiment extremes that form impulsive wave structures. While fundamental news like CPI data might cause short-term volatility, the underlying wave count usually remains intact. The patterns reflect the market’s collective response to decreasing purchasing power and the search for assets that can preserve long-term value.
One common mistake is forcing a bullish count when the market structure suggests a correction is still ongoing. Traders also frequently ignore the hard rules, such as allowing Wave 4 to overlap with the territory of Wave 1 in an impulsive move. Another error is misidentifying a complex B-wave rally as the start of a new impulse. Staying objective and adhering to the core guidelines of the theory is essential for long-term accuracy.
The Elliott Wave calculator streamlines the process of projecting price targets by applying Fibonacci ratios to your identified wave peaks and troughs. For gold, this is particularly useful for calculating the 1.618 extension for Wave 3 or the 0.618 retracement for Wave 2. These mathematical levels act as natural magnets for price action. Using a calculator removes the guesswork and provides concrete levels for setting profit targets and managing your stop-loss orders.
An impulse wave consists of a five-wave sequence that moves in the direction of the primary trend, displaying strength and momentum. In contrast, a corrective wave is a three-wave structure that moves against the trend to consolidate gains. Gold is known for its powerful five-wave impulses and its tendency to produce deep, complex corrections. Distinguishing between the two is the key to knowing whether to stay in a trade or exit the market.
A wave count is invalidated when the price action violates one of the three core rules of the theory. For example, if Wave 2 retraces more than 100% of Wave 1, or if Wave 4 enters the price zone of Wave 1, the count is no longer valid. When this happens, it’s a signal to step back and re-analyze the structure. This objective invalidation process is what makes the methodology a powerful and essential risk management tool.
DISCLAIMER
Any reviews, news, analysis, prices or other information contained on our website is provided as general market commentary and delivered electronically through a distribution channel to larger number of clients, therefore does not constitute investment advice or investment research. We are not trading advisors. Most of our work is for educational purposes only, with information based on Elliott Wave theory in real time. Trading forex, futures, options, stocks, cryptocurrenices or any another trading market carries a high level of risk, and may not be suitable for all investors.
The possibility exists that you could lose some or all of your initial investment; therefore you should not invest money that you cannot afford to lose. Our website and the information that we provide should not be relied upon as a substitute for extensive independent research before making your investment decisions. In no event will we be liable for any loss or damage on your account in connection with, the use of our products. For any real cash investments you have to contact your financial advisor.
Any information or material contained on our website is owned by Val Global d.o.o.. Reproduction is prohibited without Val Global d.o.o. prior license in writing.
By continuing to use the site, you agree to the use of cookies. Learn more.
The cookie settings on this website are set to "allow cookies" to give you the best browsing experience possible. If you continue to use this website without changing your cookie settings or you click "Accept" below then you are consenting to this.