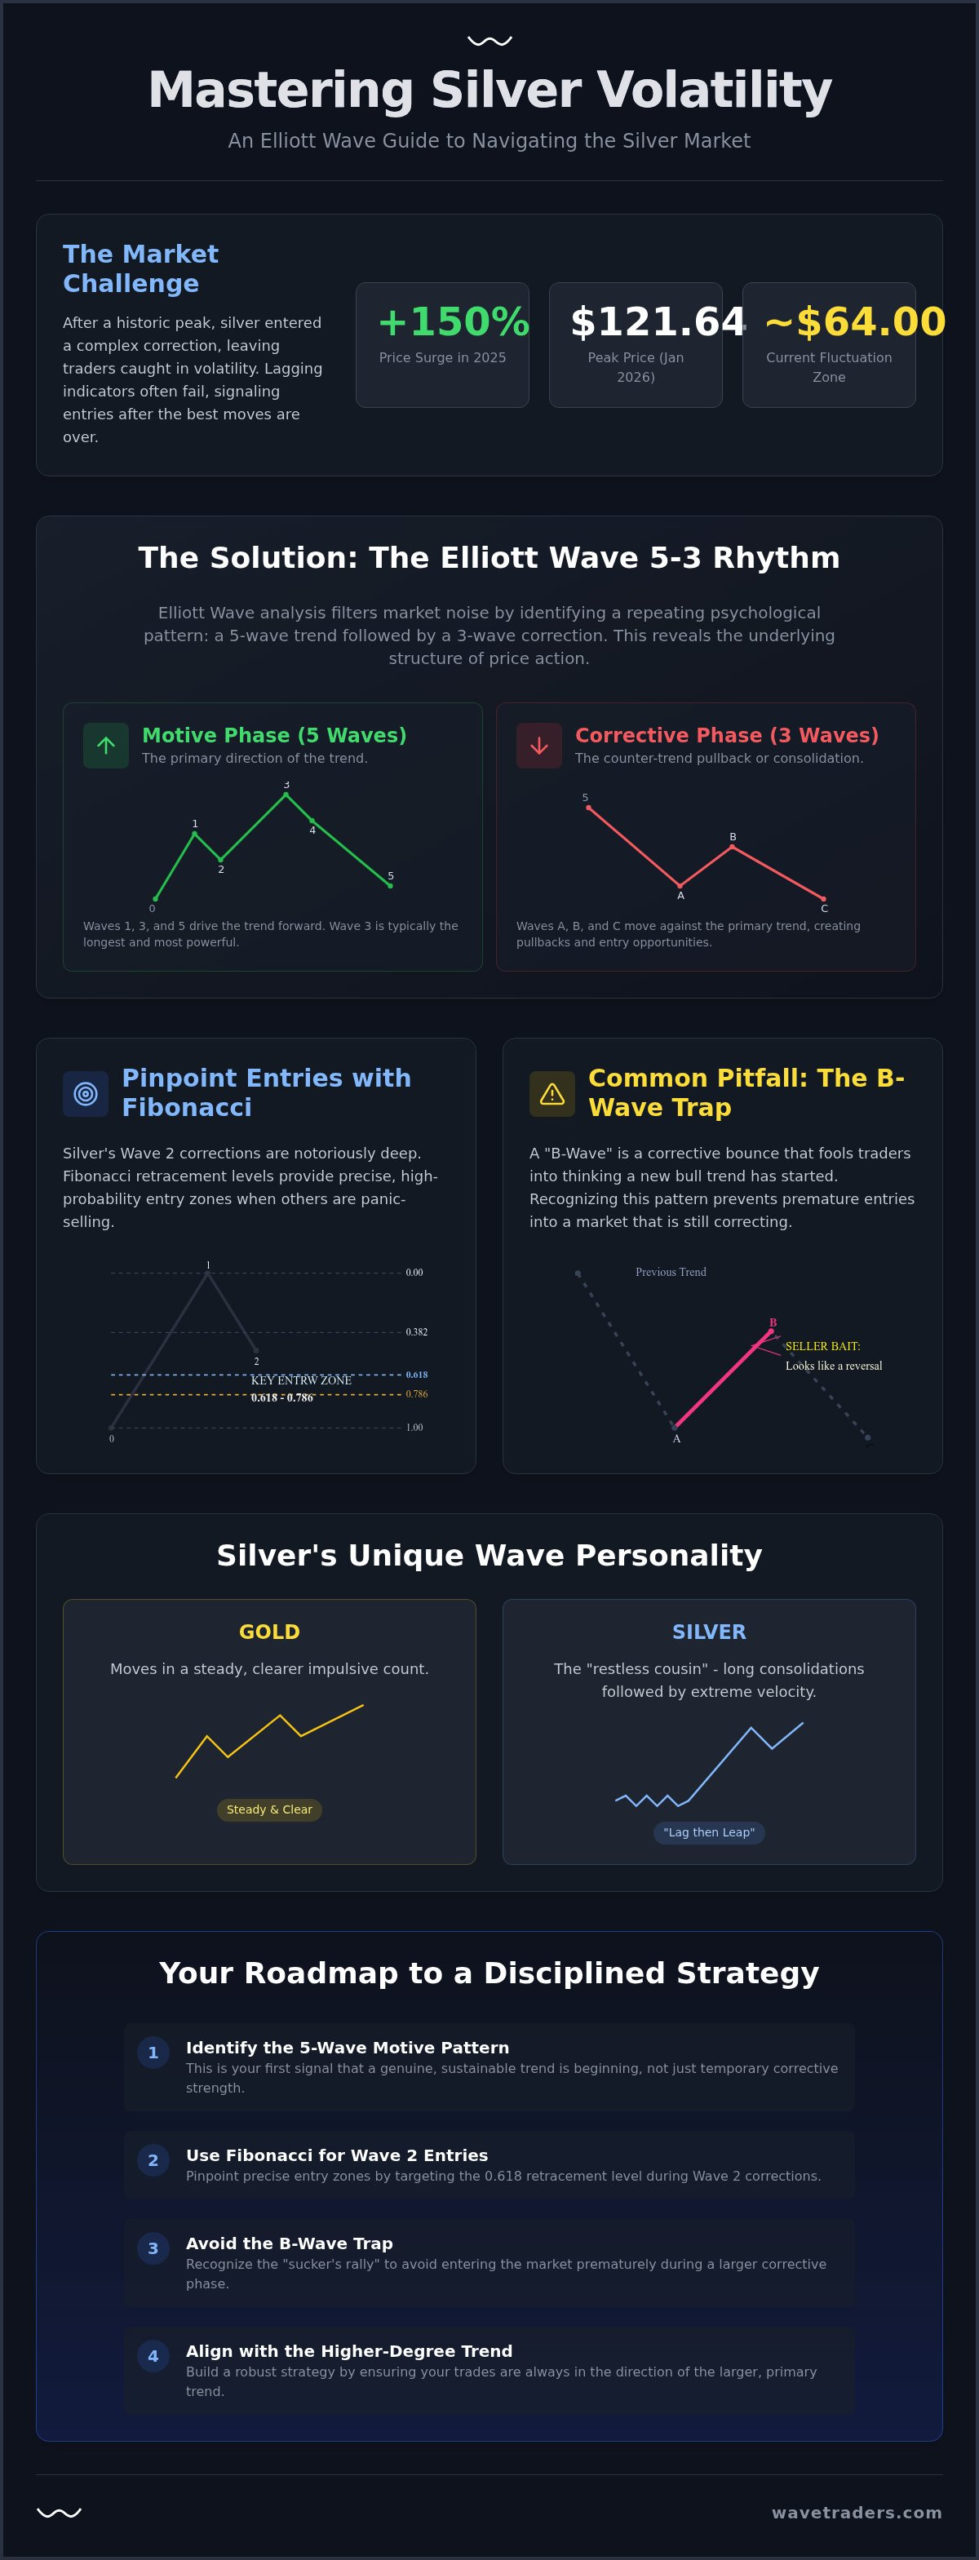
After silver prices surged nearly 150% in 2025 and peaked at a historic $121.64 in January 2026, many traders expected the momentum to stay. Instead, the market shifted into a complex correction that has left even seasoned investors feeling chopped up by the resulting volatility. Using silver Elliott Wave analysis allows us to see past this noise to find the underlying rhythm. It’s frustrating to watch a promising rally dissolve into a corrective bounce just as you decide to enter. You’ve likely felt the sting of lagging indicators that signal a buy long after the most profitable move has already passed.
This guide will help you master the patterns of the silver market to identify high-probability trend reversals and price targets. You’ll learn to see the hidden structure within the price action, which is essential when spot prices are fluctuating near $64.00 amidst new COMEX rules and export restrictions. We will examine the current wave count for late 2026, distinguish between impulsive rallies and corrective traps, and use precise Fibonacci targets to plan your entries and exits. By the end, you’ll have a roadmap for managing these commodity cycles with a clear, objective methodology.
Trading silver often feels like trying to catch lightning. The price swings are notoriously aggressive, often defying standard technical indicators. By applying the Elliott Wave Principle, we move away from reacting to price and start anticipating structure. This methodology identifies a repeating 5-3 rhythm: five waves of a trend followed by three waves of correction. In the context of silver, this rhythm is driven by the collective psychology of participants, ranging from industrial buyers to speculative retail traders.
Headlines in 2026, such as China’s export licensing system or the U.S. SILVER Act, create significant short-term volatility. However, silver Elliott Wave analysis helps you filter this noise. Instead of asking what a specific news event means, we ask where the price sits within the current wave degree. This focus on market structure prevents the common mistake of chasing a news-driven spike that is actually the terminal point of a Wave 5. It allows us to view the market through a lens of probability rather than reacting to the chaos of the daily tape.
Silver is the restless cousin of gold. While gold might move in a steady, clear impulsive count, silver frequently enters long periods of sideways consolidation. When it finally breaks out, it does so with extreme velocity. We call this the “lag then leap” effect. Traders often see gold start its Wave 3 while silver is still grinding through a Wave 2 correction. Identifying these catch-up trades is a hallmark of a professional commodity strategy. Using wave degrees helps us distinguish whether a sudden 10% move is a minor short-term spike or the beginning of a multi-year trend.
The psychology of silver is extreme. Because approximately 60% of silver is used for industrial purposes, including AI infrastructure and green energy, Wave 3 moves are often extended. These impulsive rallies represent a period where industrial urgency meets speculative FOMO. Conversely, Wave 2 and Wave 4 corrections in silver are notoriously deep. It is common to see a 0.618 or even a 0.786 retracement, which often shakes out weak hands before the next leg up begins. Understanding these deep dips allows you to remain calm when the rest of the market is panicking.
To successfully analyse commodity markets, you must look past immediate price action and identify recurring geometric shapes on the chart. In silver, the primary building block is the 5-wave motive sequence. This pattern signals the start of a major bull run, where waves 1, 3, and 5 move in the direction of the trend, while waves 2 and 4 act as temporary pullbacks. Because of silver’s industrial demand and speculative appeal, its motive waves often feature extensions. A Wave 3 or Wave 5 might stretch far beyond standard expectations, creating the parabolic moves that define this metal’s history.
Corrective patterns represent the consolidation phases that test a trader’s patience. We typically see zig-zags, which are sharp and deep, or flats, which move sideways. Spotting these early is crucial for effective silver Elliott Wave analysis. For instance, an ending diagonal at the conclusion of a Wave 5 warns of trend exhaustion. It signals that the previous momentum is fading and a significant reversal is likely. Recognizing these structural shifts helps you exit positions before the volatility turns against you. If you’re looking to deepen your understanding of these structures, our Elliott Wave School provides a structured path for mastering pattern recognition.
The third wave is usually the strongest and longest part of the sequence. It’s characterized by breakaway gaps and high volume as the broader market realizes the trend has changed. Beginners often make the mistake of trying to short these moves because indicators like RSI show the market is overbought. However, a Wave 3 can stay overbought for weeks as the trend accelerates. To avoid being caught on the wrong side, you can use the Elliott Wave Forex Calculator to project potential targets based on the length of Wave 1. This provides an objective price level to watch rather than relying on subjective feelings about the price being too high.
Silver is famous for the expanded flat, a corrective pattern where the B-wave breaks above the start of the previous impulsive wave. This creates a fake-out that traps breakout buyers before the C-wave plunges to new lows. Managing risk here requires understanding that the B-wave must be a three-wave structure. If you see silver break a previous high on weak momentum during a correction, it’s often a signal to stay cautious. Mastering these nuances is what separates professional practitioners from those who get lost in the noise of the daily tape.
Elliott Wave theory provides the structural framework for the market, but Fibonacci ratios provide the mathematical precision required for execution. In silver Elliott Wave analysis, these ratios act as price magnets that help us forecast where a specific move might terminate. While the patterns tell us the direction, the ratios tell us the depth and height. This relationship is particularly vital in commodities, where sentiment can push prices to extremes that standard technical indicators often fail to capture.
Silver’s high volatility means it often respects deeper retracement levels than more stable assets. While a major stock index might only pull back to a 0.382 level during a Wave 2, silver frequently dives toward the 0.618 or even the 0.786 retracement. This can be unsettling for traders who aren’t prepared for the depth of these moves. However, understanding these levels allows you to place more logical stop losses. A disciplined approach to Elliott Wave risk management tells you exactly when a count is invalidated — specifically, if price action breaks below the start of Wave 1, the count is invalidated, and we must reassess the structure.
When silver enters an impulsive Wave 3, we look for extensions. The 1.618 extension is our primary target, but in the case of a supply squeeze or extreme industrial demand, we often see 2.618 or even 4.236 levels reached. These “blow-off” moves are where the most significant gains are found. Conversely, Wave 4 pullbacks are typically shallower. In a strong bull market, the 0.382 retracement serves as a high-probability entry point for those who missed the initial surge and are looking for a final leg up in Wave 5.
Silver’s unique personality often results in deep corrections that shake out retail participants before the next impulsive leg begins. By identifying these zones, we can manage risk more effectively and avoid entering too early. The 0.618 Golden Ratio represents the most common retracement level for a silver Wave 2, acting as a critical support zone before the trend resumes. Using this level helps us distinguish a healthy correction from a potential trend failure, especially when the spot price is fluctuating near key psychological levels like $64.00.
As a move matures, we can project the Wave 5 peak by taking 0.618 of the net distance traveled from the start of Wave 1 to the top of Wave 3. We then add this distance to the bottom of Wave 4 to find our target. It’s also helpful to look for momentum divergence at these peaks. If silver makes a new high at a Wave 5 target while momentum indicators make a lower high, the cycle is likely nearing completion. To gain a broader perspective on market sentiment, we often compare these results to our EUR/USD Elliott Wave analysis, as dollar strength remains a primary driver for precious metals in 2026.
Success in the silver market requires more than just knowing the patterns; it requires the discipline to avoid psychological traps. One of the most frequent errors in silver Elliott Wave analysis is mistaking a B-wave bounce for the start of a new bull market. These rallies often look impulsive and strong, fueled by social media hype or “silver squeeze” narratives. However, without a clear five-wave structure, these moves are usually just part of a larger correction that eventually leads to lower lows. Ignoring the wave degree is another common pitfall. Traders often get lost in the minute details of a 15-minute chart and lose sight of the primary trend, leading to entries that are out of sync with the broader market cycle.
Simplicity is your best ally when dealing with volatile commodities. Over-complicating a count by trying to label every minor squiggle often leads to “analysis paralysis.” If a count doesn’t look clear, it’s usually because the market is in a complex correction where staying on the sidelines is the safest play. It’s better to wait for a clean, recognizable setup than to force a label onto a chaotic chart. Relying on static strategies like dollar-cost averaging can be dangerous during a multi-year C-wave decline, which is why structural analysis is so vital.
Elliott Wave is often criticized for being subjective, but this usually stems from a failure to distinguish between rules and guidelines. Rules, such as Wave 3 never being the shortest, are absolute. Guidelines, like the tendency for Wave 2 to be a deep retracement, are probabilities. To stay objective, you must always maintain an alternate count. This “Plan B” tells you exactly when your primary thesis is wrong, allowing you to exit a losing trade before it causes significant damage. Pairing this discipline with a structured approach to Elliott Wave risk management and position sizing ensures that no single failed count can derail your overall trading performance. For a true 2026 perspective, your analysis should start from the 2011 high near $50.00 and the subsequent 2026 peak of $121.64 to understand where we sit in the multi-decade cycle. If you want to refine your counting skills with professional guidance, you can join our Elliott Wave School to learn our objective methodology.
Silver’s impulsive nature creates “noisy” charts filled with long wicks and stop hunts. These wicks can pierce through Fibonacci levels, making it difficult to maintain a clean count on a standard candlestick chart. In these cases, switching to a line chart based on closing prices can filter out the noise and reveal the true underlying structure. Because of this inherent volatility, position sizing is just as important as the wave count itself. You don’t need a massive position to profit from a silver Wave 3. Smaller sizes with wider stops often allow you to stay in a trade through the “shake-outs” that are common in precious metals.
A successful silver strategy isn’t built on chasing green candles or reacting to geopolitical headlines. It starts with identifying the higher-degree trend. For example, knowing whether silver is in a Primary Wave 3 or a corrective B-wave determines your risk appetite and profit expectations. Once we establish that the primary trend is bullish, the next step is patience. We look for a completed three-wave correction to provide a high-probability entry point. This methodical approach is the core of silver Elliott Wave analysis, allowing you to enter the market with a defined invalidation level based on market structure rather than emotion. You don’t need to catch every move; you only need to catch the ones with the highest probability.
Mastering these patterns takes time and deliberate practice. Many traders fail because they lack a consistent framework for interpreting price action in volatile commodities. Our Elliott Wave School is designed to bridge this gap, moving you from subjective guessing to objective counting. As your hit rate stabilizes and you demonstrate a disciplined application of the rules, you can transition to our Funded Trader Program. This program provides an opportunity to trade our capital, allowing you to scale your trading size without the psychological pressure of risking your own savings. It’s a path designed for those who want to treat trading as a professional endeavor.
While learning the methodology is essential for long-term independence, the speed of the 2026 market often requires immediate insights. Our Digital Currency and Commodity service provides live updates on silver’s wave counts, helping you stay aligned with the trend as it unfolds in real time. You’ll learn the “Wavetraders way” through a comprehensive video lesson curriculum that explains the reasoning behind every chart and target. This combination of education and real-time application helps you internalize the patterns faster than studying in isolation. For those ready to professionalize their approach, you can apply for our Funded Trader Program and trade silver with our capital once you meet our consistency requirements and pass the evaluation phase.
If you’re new to this methodology, start with our “Elliott Wave for Beginners” video series. It lays the groundwork for understanding motive and corrective structures without overwhelming you with technical complexity. From there, join our community to track the 2026 silver cycle alongside professional analysts who have tracked these commodity markets for decades. Having a mentor and a peer group ensures you stay focused on the high-probability setups while avoiding common psychological traps like FOMO or revenge trading. If you want to extend this structured learning into the currency markets, our guide to choosing the right Elliott Wave forex course in 2026 can help you evaluate which curriculum will bridge the gap between theory and live execution. Take the first step toward precision and consistency today.
Apply for Wavetraders Membership and Get Real-Time Silver Analysis Today
Navigating the silver market in 2026 requires more than just watching the spot price. It demands a structured approach to understand the underlying sentiment driving every impulsive surge and corrective dip. By mastering silver Elliott Wave analysis, you move away from the noise of daily headlines and toward a methodology based on objective market structure. You’ve learned how to identify the power of the third wave, use Fibonacci levels for precise entries, and avoid the common pitfalls of social media hype.
Wavetraders has provided expert market education since 2003, helping traders move from guessing to counting with confidence. Whether you are looking to refine your pattern recognition through our comprehensive Elliott Wave School curriculum or seeking to scale your approach with our Funded Trader Program opportunities, we provide the tools and community support needed to succeed. The path to professional trading is built on consistency and a proven framework.
Start Your Elliott Wave Journey with Wavetraders Today and join a community dedicated to tracking these cycles with precision. We look forward to tracking the markets together with you.
Elliott Wave analysis is highly reliable for silver precisely because of its high volatility. Extreme price moves are driven by mass psychology, which is exactly what the wave principle measures. In a fast-moving market, the structural rules help you stay grounded when others are panicking. While no method is perfect, the clear 5-3 rhythm often becomes more visible during high-momentum periods.
The most common patterns in silver are extended third waves and deep zig-zag corrections. Because silver has a dual role as both an industrial and a precious metal, its impulsive moves often stretch beyond standard targets. Conversely, its corrective phases are notoriously sharp. Traders should expect deep retracements that test the patience of even the most experienced participants.
You cannot use identical wave counts for silver and gold even though they often move in the same direction. Silver frequently exhibits “lag then leap” behavior, where it remains in a correction while gold begins an impulsive rally. These differences in wave personality mean that each metal requires its own independent analysis to determine precise entry and exit points.
A market “short squeeze” typically manifests as a sharp extension within a Wave 3 or a terminal Wave 5. While these events feel chaotic, they rarely break the core rules of market structure. Instead, they push Fibonacci extension ratios to their upper limits, such as the 2.618 or 4.236 levels. Understanding this helps you avoid exiting a profitable trade too early during a squeeze.
Fibonacci levels act as price magnets that help you identify where a wave is likely to terminate. In silver Elliott Wave analysis, we use these ratios to find high-probability reversal zones. For example, a 0.618 retracement often marks the end of a Wave 2, while a 1.618 extension is the standard target for a Wave 3. These levels provide an objective way to set profit targets.
The best timeframes for analysis depend on your trading style, but a multi-timeframe approach is usually most effective. We start with weekly and daily charts to identify the primary trend and higher-degree wave counts. Once the broader direction is clear, we zoom into the 4-hour and 1-hour charts to spot the sub-waves. This allows for more precise entries with tighter risk management.
You don’t need specialized software to perform counts, but using a dedicated Elliott Wave Calculator significantly improves your accuracy. Most standard charting platforms allow you to draw the waves manually. The key isn’t the software itself, but the ability to apply the rules consistently. Our proprietary tools are designed to simplify this process by calculating Fibonacci targets automatically based on your wave labels.
The Wavetraders Elliott Wave School provides a structured curriculum that moves you from theory to practical application. We teach you how to distinguish between impulsive rallies and corrective bounces in the silver market. By learning the objective rules of the methodology, you stop guessing about the next move and start counting with a professional framework. This education is the foundation for our Funded Trader Program.
DISCLAIMER
Any reviews, news, analysis, prices or other information contained on our website is provided as general market commentary and delivered electronically through a distribution channel to larger number of clients, therefore does not constitute investment advice or investment research. We are not trading advisors. Most of our work is for educational purposes only, with information based on Elliott Wave theory in real time. Trading forex, futures, options, stocks, cryptocurrenices or any another trading market carries a high level of risk, and may not be suitable for all investors.
The possibility exists that you could lose some or all of your initial investment; therefore you should not invest money that you cannot afford to lose. Our website and the information that we provide should not be relied upon as a substitute for extensive independent research before making your investment decisions. In no event will we be liable for any loss or damage on your account in connection with, the use of our products. For any real cash investments you have to contact your financial advisor.
Any information or material contained on our website is owned by Val Global d.o.o.. Reproduction is prohibited without Val Global d.o.o. prior license in writing.
By continuing to use the site, you agree to the use of cookies. Learn more.
The cookie settings on this website are set to "allow cookies" to give you the best browsing experience possible. If you continue to use this website without changing your cookie settings or you click "Accept" below then you are consenting to this.