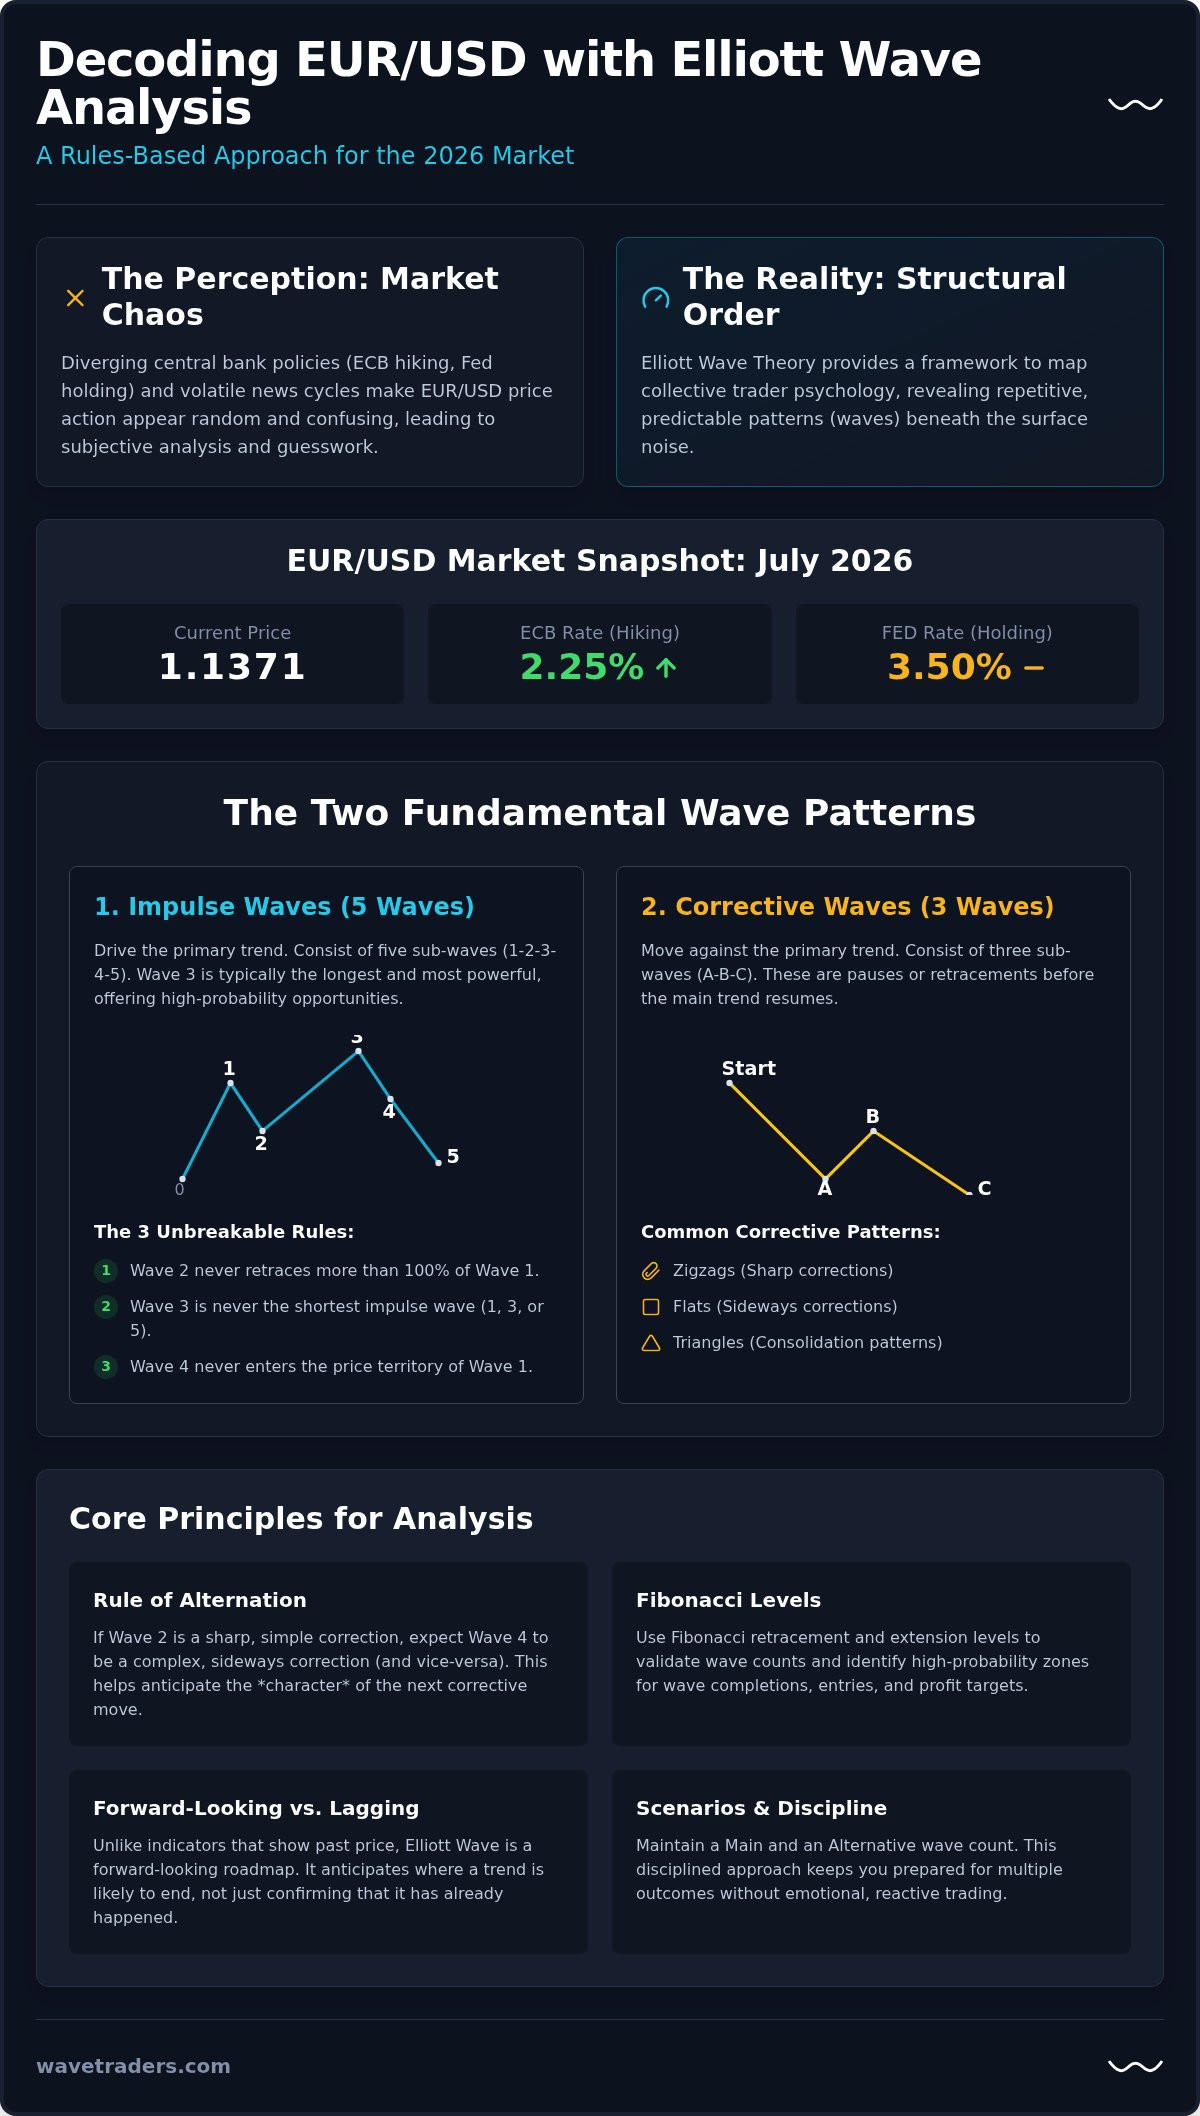
Most traders view the current EUR/USD price action as a chaotic reaction to diverging central bank policies, but the market’s structure is far more orderly than it appears. It’s frustrating to stare at a chart cluttered with indicators only to find your counts are still subjective and prone to error. You aren’t alone in feeling that the noise of the July 2026 market, where the ECB is signaling hikes while the Fed holds steady at 3.5%, makes traditional analysis feel like guesswork. This guide will show you how to apply a methodical eurusd elliott wave analysis to strip away the confusion and reveal the high-probability setups hidden within the current 1.1371 price level.
You’ll discover a clear framework to decode complex movements and identify where the next major trend reversal might occur. We’ll examine the current primary count for the pair, identify the specific rules for spotting powerful Wave 3 opportunities, and establish objective signals for your entries and exits. By the end of this analysis, you’ll have the tools to track the markets with the composure of a professional practitioner, replacing chart clutter with a disciplined, rules-based approach.
The 2026 financial landscape is defined by a complex tug-of-war between the European Central Bank and the Federal Reserve. With the current exchange rate at 1.1371, the ECB maintaining a deposit rate of 2.25%, and the Fed holding steady at 3.5%, traders often find themselves caught in the crossfire of conflicting data points. This is where a methodical eurusd elliott wave analysis becomes indispensable. Rather than reacting to every headline, this approach treats price action as a reflection of collective human psychology. It’s about understanding that the market isn’t just a series of random events, but a structured progression of sentiment.
The Elliott Wave Principle is a mathematical discovery of market rhythm by Ralph Nelson Elliott. It suggests that markets move in recognizable, repetitive patterns called waves. Because the EUR/USD is the most liquid currency pair in the world, it provides the cleanest laboratory for these patterns. High liquidity ensures that the price action represents the broad consensus of thousands of participants. This makes the fractal nature of the market easier to identify. Fractals are simply patterns that repeat at different scales. A structure visible on a weekly chart often mirrors a smaller version on a five-minute chart. Understanding how each of these scales relates to one another requires having Elliott Wave degree explained clearly, so you can align your counts across timeframes with confidence.
Moving averages and oscillators are byproducts of price, which means they inherently lag behind the current move. In the volatile environment of 2026, a moving average crossover might occur just as a trend is exhausting itself. Elliott Wave provides a forward-looking roadmap instead of a backward-looking summary. It allows us to anticipate where a move is likely to end based on structure rather than waiting for an indicator to confirm what has already happened. This perspective is vital when the market enters complex corrective phases that often trap indicator-based traders.
Traders often struggle to distinguish between a news-driven spike and a genuine trend change. While an unexpected ECB rate announcement might cause a sudden 100-pip move, that spike usually fits perfectly into a pre-existing wave count. By maintaining a Main Scenario and an Alternative Scenario, we stay prepared for multiple outcomes without losing our orientation. A disciplined eurusd elliott wave analysis helps you realize that while news might act as a catalyst for speed, the underlying structure usually dictates the direction. This structural clarity is what allows a practitioner to remain calm while others are chasing the latest candle.
At the current market price of 1.1371, the Euro is providing a textbook lesson in structural development. To perform an effective eurusd elliott wave analysis, you must first distinguish between motive waves, which drive the trend, and corrective waves, which offer temporary pauses. In July 2026, we’re seeing the pair react to a significant resistance zone near 1.1436. Whether this move develops into a full five-wave impulse or remains a three-wave correction will determine the trading strategy for the months ahead. Understanding these structures allows you to look past the daily volatility and see the broader cycle at play.
Motive waves are the engines of the market, consisting of five distinct sub-waves that move the price in the direction of the larger trend. For a count to be valid, it must adhere to three unbreakable rules. First, Wave 2 can’t retrace more than 100% of Wave 1. Second, Wave 3 is never the shortest of the three action waves. Third, Wave 4 can’t enter the price territory of Wave 1. Understanding and correctly applying the 3 rules of Elliott Wave is what separates valid counts from subjective guesswork, and mastering them is essential before attempting to trade any impulse structure. In the EUR/USD, we often see an “extended” wave where one of the motive segments is significantly longer than the others. Wave 3 is typically the longest and strongest move in a currency trend. Identifying the start of this extension is often the difference between a mediocre trade and a highly profitable one.
While impulse waves are relatively straightforward, corrections are where most traders lose their way. These three-wave sequences (A-B-C) can take the form of Zigzags, Flats, or Triangles. In the current 2026 environment, Wave 4 is proving to be a point of frustration as it moves sideways, often trapping those who expect a direct continuation. We use the Rule of Alteration to anticipate these moves. If Wave 2 was a sharp and simple retracement, Wave 4 will likely be a complex, time-consuming pattern. This is why many practitioners find themselves waiting for a clear breakout before committing to a new position. You can learn more about Expanded Flat patterns to help identify these tricky structures before they catch you off guard.
Successfully tracking these cycles requires patience and a refusal to force a count where one doesn’t exist. If the price remains below the 1.1436 level, the primary scenario suggests a motive move toward the 1.1124 target. However, if the structure shifts, we must be ready to pivot. For those who want to see these counts updated in real-time, our FX Service provides the structural clarity needed to stay ahead of the curve. By focusing on the internal wave structure rather than just the price, you gain a perspective that standard indicators simply can’t provide.
Elliott Wave patterns provide the structural map of the market, but Fibonacci ratios offer the precise coordinates. The relationship between these two concepts is symbiotic. Without Fibonacci, a eurusd elliott wave analysis is merely a collection of subjective shapes. By applying these mathematical ratios, we can validate whether a specific price move is a genuine wave or just random market noise. In the current 2026 environment, where the Euro sits at 1.1371, these levels help us determine if the recent rejection at 1.1436 is a minor pause or the start of a deeper correction.
When we look at the rhythm of the EUR/USD, we expect waves to adhere to specific proportions. Wave 2 typically retraces deep into the territory of Wave 1, often stalling at the 61.8% or 78.6% levels. Conversely, Wave 4 is usually shallow, frequently finding support at the 38.2% retracement of the preceding Wave 3. These ratios aren’t magic numbers; they represent the natural ebb and flow of trader sentiment as it shifts from exuberant buying to calculated profit-taking. The same Fibonacci principles that validate EUR/USD counts are equally powerful when applied to commodities, as demonstrated in silver Elliott Wave analysis navigating commodity cycles in 2026, where these ratios help identify key reversal zones after historic price surges.
The 0.618 level is often called the “Golden Ratio” for a reason. In a trending EUR/USD market, this is the most common area for a Wave 2 to terminate before the powerful Wave 3 begins. If the price bounces cleanly off this level, it provides high-conviction evidence that the primary trend is ready to resume. Setting stop-losses just beyond these Fibonacci invalidation levels allows for a disciplined approach to risk. For instance, if a count suggests we are in a Wave 2 retracement, a move beyond the start of Wave 1 immediately proves the count wrong, protecting your capital from further downside.
While retracements tell us where to enter, extensions tell us where to exit. Calculating the 1.618 extension of Wave 1 is the standard method for projecting the target of Wave 3. We also look for “Cluster Levels,” which occur when Fibonacci projections from different wave degrees align at a single price point. This alignment suggests a high probability of a trend reversal. We also monitor the “fetch wave” concept, which helps us understand when momentum is reaching exhaustion near these major extension targets. Identifying these zones prevents the common mistake of staying in a trade too long as the market prepares for a corrective shift.
Manual math can be slow in a fast-moving market. To streamline this process, we utilize the Elliott Wave Calculator to automate these projections instantly. This tool allows you to plug in the start and end points of a wave and receive the most probable Fibonacci targets for the subsequent move. By combining these objective mathematical levels with your structural analysis, you move away from guessing and toward a methodical, rules-based trading style.
Execution is where many analysts struggle, as even a perfect count can lead to losses without a disciplined entry plan. Much like the intentional approach found in strength programs like Evora Training, a successful eurusd elliott wave analysis must be paired with a repeatable, rules-based strategy to remove emotional bias. In the current market environment, characterized by the 1.1371 price level and significant resistance at 1.1436, following a structured five-step process helps you stay on the right side of the trend. This methodical approach ensures you aren’t just guessing at turns, but reacting to confirmed structural shifts.
The first step requires identifying the higher-degree trend on the daily or weekly charts to establish your directional bias. Once you know which way the larger tide is flowing, you look for a completed five-wave impulse in that same direction. This is followed by the third step: waiting for a corrective three-wave pullback (an A-B-C sequence) that reaches one of the Fibonacci support levels we identified earlier, such as the 61.8% retracement. Instead of entering blindly at a level, step four involves waiting for the break of the Wave B high. This price action confirms that the correction has likely ended and the next impulse wave has begun. Finally, manage the trade by trailing your stops at the most recent wave degree troughs to lock in profits while allowing the trend to breathe. Correctly categorizing which wave degree you are trading on each timeframe is essential here; a thorough understanding of Elliott Wave degree explained across market fractals and timeframes will ensure your higher-degree bias and lower-degree entries remain properly aligned.
Specific wave patterns often provide early warnings or confirmation signals that standard oscillators miss. A Leading Diagonal in the Wave 1 position can serve as an early entry signal, suggesting that a powerful new trend is forming. Conversely, identifying an Ending Diagonal, which often looks like a narrowing wedge, is your cue to exit a position before a major EUR/USD reversal occurs. These patterns act as the market’s way of signaling momentum exhaustion. To refine your timing further, you can explore our Elliott Wave Entry and Exit Signals Guide for deeper pattern recognition. Traders who also follow commodities will find that these same diagonal patterns appear with striking regularity in silver Elliott Wave analysis, making cross-market pattern recognition a valuable skill for any practitioner.
The most important part of any eurusd elliott wave analysis is the “Invalidation Point.” This is the specific price level where your count is proven wrong, such as when Wave 2 retraces more than 100% of Wave 1. Admitting a count is incorrect is not a failure; it is a vital part of capital preservation. You should adjust your position size based on the volatility of the current wave degree and the distance to your invalidation level. This level of discipline is exactly why the Funded Trader Program prefers analysts who use this methodology. It demonstrates a commitment to rules over impulses. If you are ready to stop chasing signals and start trading with structural precision, join our community of disciplined analysts and master the 2026 cycles today.
Mastering a consistent eurusd elliott wave analysis is a journey that requires both high-quality data and the right mentorship. While the rules we’ve discussed provide a strong foundation, applying them to the live 2026 markets is where many traders feel the most pressure. Wavetraders exists to bridge that gap by offering a professional environment where you can observe how an experienced practitioner navigates these cycles. This transition to professional-grade systems is similar to how growing e-commerce brands partner with Warenous to manage complex 3PL logistics, allowing them to focus on strategy rather than back-end noise. It’s about moving away from the anxiety of isolated decision-making and into a community that values methodical observation over market hype.
Being part of a community of practitioners means you’re no longer interpreting the 1.1371 price level in a vacuum. Our members track the 2026 cycles together, sharing observations and validating counts in a calm, professional atmosphere. This collective focus helps filter out the emotional spikes that often lead to poor execution. When you see how others are applying the same rules-based eurusd elliott wave analysis, your own confidence in the methodology grows. You start to see the market not as a series of threats, but as a sequence of opportunities waiting for confirmation.
Our FX Service is designed for traders who need structural clarity without the noise of typical alert services. We provide the tools you need to stay oriented in any market condition:
The transition from theory to live execution is often the steepest part of the learning curve. Our video lessons address this by walking you through the actual process of chart labeling and target projection. We don’t just show you a finished count; we show you the logical progression used to arrive at that conclusion. This transparency is vital for developing the skills that distinguish a professional from a hobbyist.
For those who want to master the art of counting independently, the Elliott Wave School offers a structured path to self-sufficiency. Many try to learn through disjointed YouTube videos, but this often leads to the very subjectivity we aim to avoid. Our curriculum takes you from the basics of motive waves to advanced Neowave concepts in a logical, step-by-step fashion. It’s education that sticks because it’s taught by practitioners who are tracking these same markets every day. If you’re ready to take control of your trading future, you can apply for the Elliott Wave School and start your journey today.
Deciphering the 2026 market doesn’t have to be a process of intuition or guesswork. By shifting your focus to the underlying structure, you’ve learned how a methodical eurusd elliott wave analysis can transform chaotic price action into a clear, actionable roadmap. Whether you’re validating a Wave 2 retracement using the Golden Ratio or identifying a high-probability Wave 3 extension, the goal remains the same: trading with a calm, objective perspective that standard indicators simply can’t provide.
Success in the FX markets is built on the foundation of a disciplined strategy and continuous education. With over 20 years of market analysis expertise, Wavetraders provides the environment you need to sharpen your skills. From our comprehensive Elliott Wave School curriculum to our exclusive Elliott Wave Calculator, we give you the professional tools to track these patterns with precision. It’s time to move past the noise and start following the markets with the composure of a seasoned practitioner. Get Real-Time EUR/USD Elliott Wave Analysis – Join Wavetraders Today and begin your journey toward market mastery. We look forward to tracking the next major move together.
EUR/USD is widely considered the ideal pair for wave counting due to its immense liquidity. High trading volume ensures that price action reflects broad market sentiment rather than the influence of a few large players. This makes the fractal patterns and structural developments much clearer than in more exotic pairs. A clean eurusd elliott wave analysis typically results from this deep pool of participants, allowing the standard rules of impulse and correction to play out with high reliability.
Accuracy in wave analysis isn’t about predicting the future with certainty but about identifying high-probability market structures. The methodology provides a map of the most likely path while establishing clear invalidation levels. By using this framework, traders can manage risk effectively by knowing exactly where a count is no longer valid. It’s a tool for professional risk management that helps you stay on the right side of the trend more often than not.
The most frequent error is forcing a count to fit a preconceived bias rather than letting the market reveal its structure. Traders often overlook the unbreakable rules, such as allowing Wave 4 to overlap with the price territory of Wave 1 in an impulse. This subjectivity leads to confusion and losses. Successful practitioners remain flexible, always maintaining an alternative scenario to account for market shifts that don’t align with their primary count. A thorough review of the 3 rules of Elliott Wave and how they define flawless wave counting can help eliminate these common errors before they cost you capital.
You can certainly apply these principles to intraday charts because market patterns are fractal. This means the same 5-wave and 3-wave sequences found on daily charts also appear on the 5-minute or 15-minute timeframes. Day traders use eurusd elliott wave analysis to identify smaller-degree Wave 3 moves, which often offer the best momentum for quick entries and exits. However, it’s essential to always keep the higher-degree trend in mind to avoid trading against the larger tide.
You don’t need expensive proprietary software to count waves, as any standard charting platform will suffice for identifying patterns. However, specialized tools can significantly improve your precision and speed. For instance, the Elliott Wave Calculator helps automate Fibonacci projections and retracements. These tools remove the manual math and reduce the risk of calculation errors, allowing you to focus entirely on pattern recognition and trade execution.
Invalidation is a critical part of the process and should be viewed as a signal to stop and reassess. When the price breaks an unbreakable rule, such as Wave 2 retracing more than 100% of Wave 1, it proves your current count is wrong. At this point, a professional analyst immediately pivots to their alternative scenario. This disciplined approach prevents hope-based trading and ensures you don’t stay in a losing position based on a flawed interpretation.
Fundamental events like Fed interest rate decisions typically act as catalysts that accelerate the completion of an existing wave structure. While news can cause sudden volatility, it rarely changes the underlying long-term trend. For example, a hawkish Fed might provide the momentum needed for a Wave 3 extension to reach its Fibonacci target. By understanding the current count, you can often anticipate how the market will react to the news before it’s even released.
Wavetraders maintains a strong relationship with funded trader programs, as these firms value the disciplined risk management inherent in wave analysis. While specific discount percentages can vary based on current promotions, members often receive exclusive access to these opportunities. It’s best to check the latest updates within the member portal or reach out to our support team. This integration helps skilled analysts transition from learning the theory to trading with significant capital.
DISCLAIMER
Any reviews, news, analysis, prices or other information contained on our website is provided as general market commentary and delivered electronically through a distribution channel to larger number of clients, therefore does not constitute investment advice or investment research. We are not trading advisors. Most of our work is for educational purposes only, with information based on Elliott Wave theory in real time. Trading forex, futures, options, stocks, cryptocurrenices or any another trading market carries a high level of risk, and may not be suitable for all investors.
The possibility exists that you could lose some or all of your initial investment; therefore you should not invest money that you cannot afford to lose. Our website and the information that we provide should not be relied upon as a substitute for extensive independent research before making your investment decisions. In no event will we be liable for any loss or damage on your account in connection with, the use of our products. For any real cash investments you have to contact your financial advisor.
Any information or material contained on our website is owned by Val Global d.o.o.. Reproduction is prohibited without Val Global d.o.o. prior license in writing.
By continuing to use the site, you agree to the use of cookies. Learn more.
The cookie settings on this website are set to "allow cookies" to give you the best browsing experience possible. If you continue to use this website without changing your cookie settings or you click "Accept" below then you are consenting to this.