What if the very indicators you rely on to confirm a trend are actually the reason you’re consistently entering trades too late? When comparing Elliott Wave vs Dow Theory, many beginners realize that while Dow identifies the tide, it often fails to signal the turn until the move is half over. You’re likely tired of lagging signals and the confusion of market noise versus meaningful corrections. We understand that identifying the exact stage of a market cycle feels like a guessing game when you’re only looking at the surface.
This guide shows you how to evolve basic trend following into a precise, fractal-based strategy. You’ll discover a clear framework for identifying market direction and learn how to transition from simple observations to advanced wave analysis. We’ll look at why these historical theories remain vital for the 2026 markets, using modern examples like the S&P 500’s climb toward the 7,470 level to illustrate how these timeless principles function in a high-volatility environment. By the end, you’ll see the market not as a series of random price points, but as a structured, predictable sequence of human psychology.
Modern technical analysis traces its roots back to Charles Dow, the founder of the Wall Street Journal. His observations at the turn of the 20th century created a framework that traders still use to navigate the complex markets of 2026. At its core, Dow Theory suggests the market discounts everything. This means that every piece of information, from central bank interest rate decisions to collective investor sentiment, is already reflected in the current price. While later systems like the Elliott Wave Principle would add layers of complexity, Dow’s foundational belief in price action remains a standard for determining broad market sentiment.
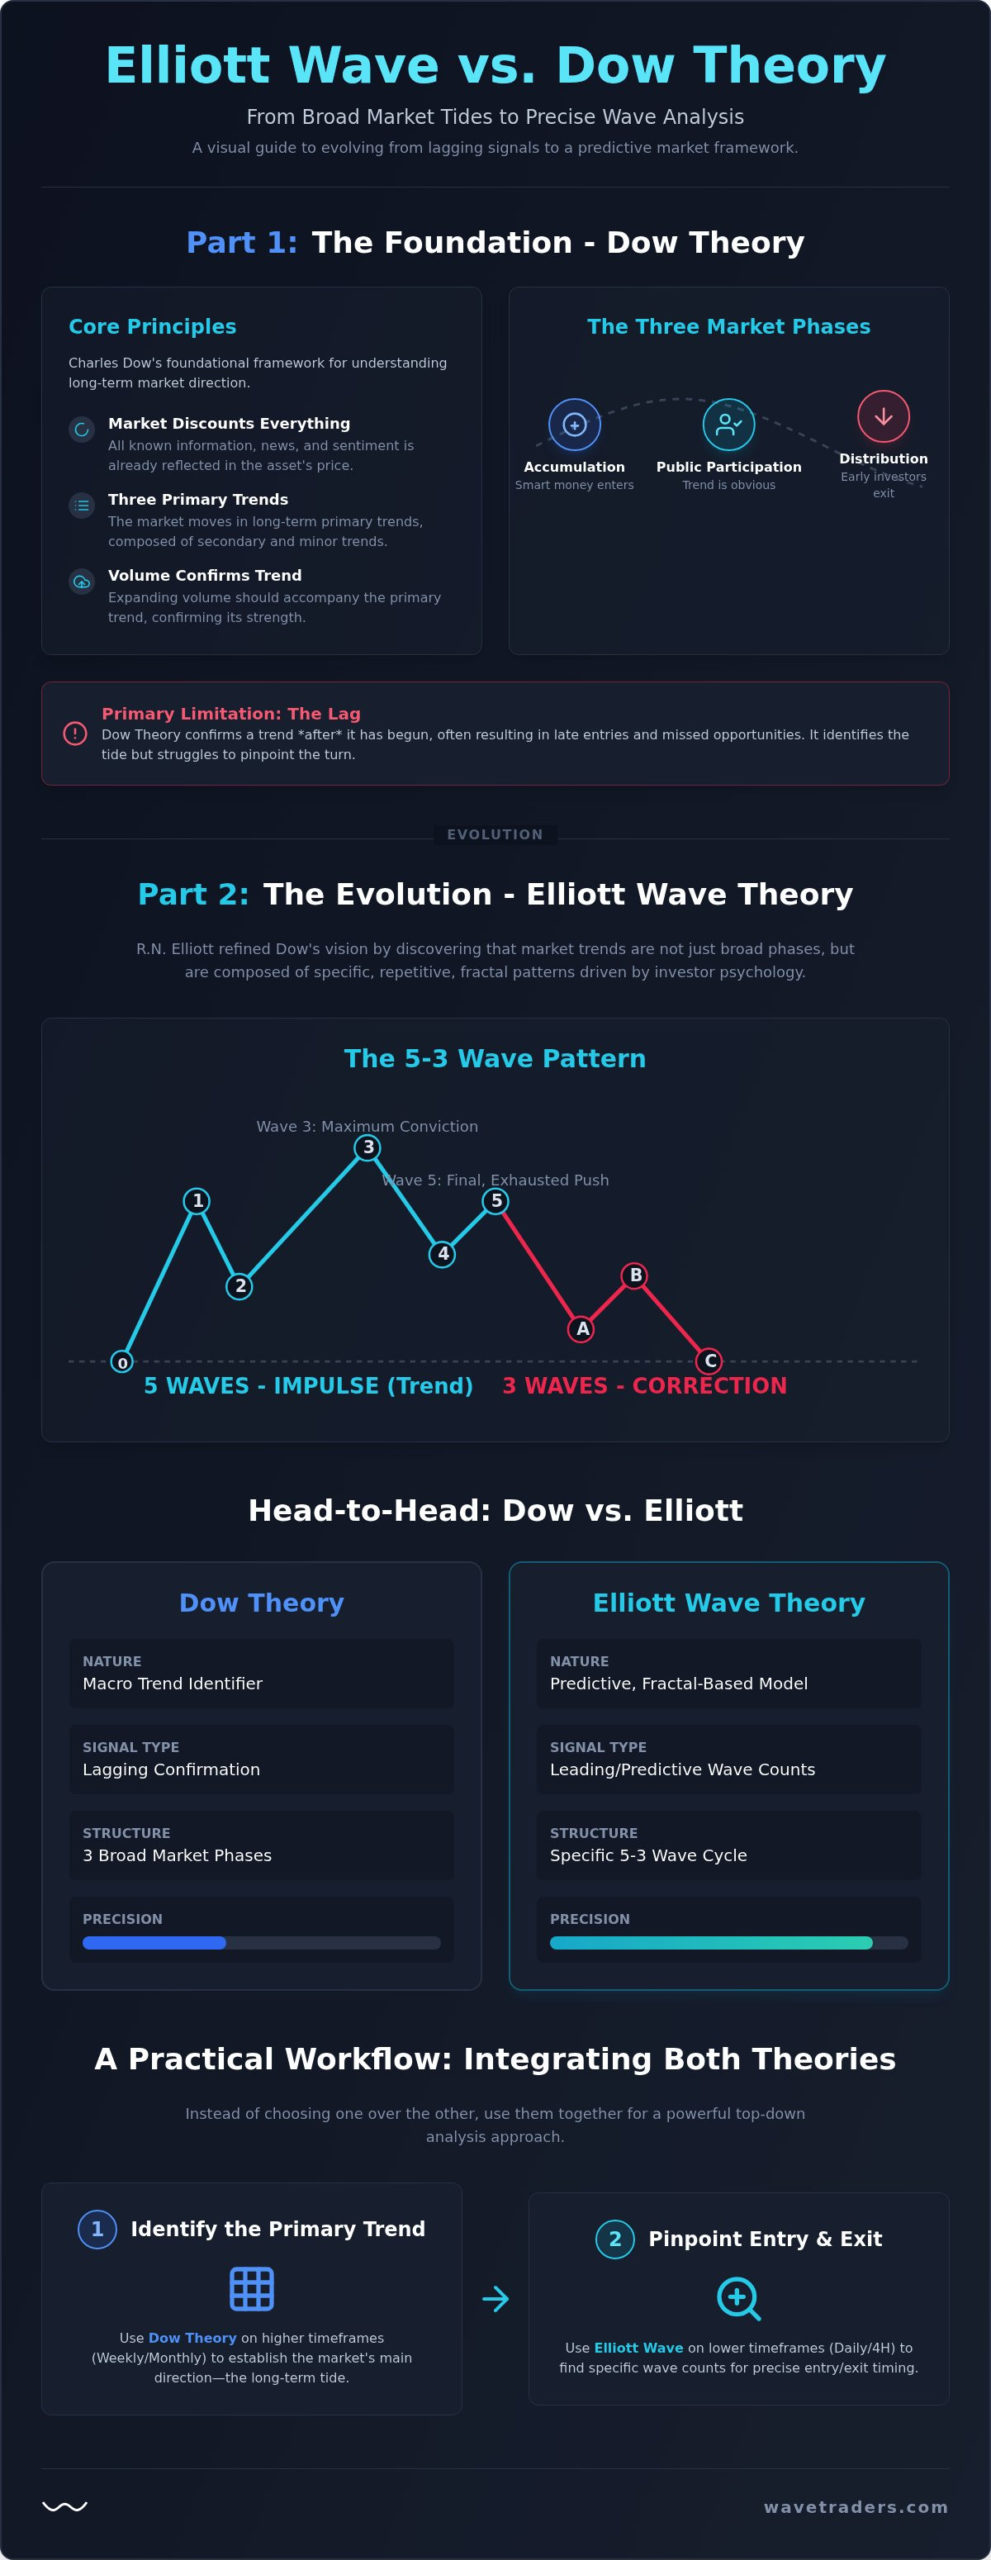
Charles Dow didn’t just invent an index; he defined the psychology of price. His work suggests that markets move through three predictable phases: accumulation, public participation, and distribution. During accumulation, seasoned investors enter the market quietly while the general public remains cautious. The public participation phase follows as the trend becomes obvious and momentum builds. Finally, distribution occurs when those early investors begin to exit their positions into the hands of latecomers. Understanding these phases is the first step in mastering Elliott Wave vs Dow Theory comparisons, as these stages form the basis for more advanced wave counting.
Dow proposed that the market moves in three distinct trends, with the “Primary Trend” acting as the long-term tide. For a trend to be valid, he argued that different market averages must confirm each other. Historically, this meant the Dow Jones Industrial Average and the Transports needed to move in the same direction. In a 2026 context, we look for similar synergy between traditional indices and high-growth sectors. Additionally, volume must expand in the direction of the primary trend to prove the move has institutional backing. Without this confirmation, any price movement might be a deceptive secondary correction rather than a true trend change.
While Dow Theory is excellent for identifying the general direction of the market, it isn’t without significant flaws for the active practitioner. The primary issue is the inherent lag. By the time the various averages confirm a trend change, the move is often well underway. This delay can result in missed opportunities or poor risk-to-reward ratios for those seeking precise entries. When weighing Elliott Wave vs Dow Theory, the lack of granularity in Dow’s model becomes apparent. It identifies the direction but struggles to pinpoint the exact stage of the cycle. Dow Theory is a macro-trend identifier that lacks micro-structure.
Ralph Nelson Elliott didn’t view his work as a replacement for Dow Theory fundamentals. Instead, he saw it as a necessary evolution. While Charles Dow identified the broad tides of the market, Elliott discovered that these tides were composed of smaller, repetitive structures called fractals. By studying decades of price data, Elliott realized that the market doesn’t just move in vague phases; it follows a specific, mathematical rhythm of five waves in the direction of the trend followed by three waves against it. This discovery transformed the debate of Elliott Wave vs Dow Theory from a choice between two systems into a logical progression from macro observation to micro precision.
Elliott’s refinement also brought a deeper layer of human psychology to market structure. Dow’s “public participation” phase is essentially a broad description of momentum, but Elliott broke this down into specific stages of sentiment. For example, Wave 3 represents the point of maximum conviction where the most money is made, while Wave 5 represents the final, exhausted push of the trend. This categorization allows traders to identify where they are within a cycle with much higher accuracy. He also introduced the concept of “Wave Degree” to help practitioners distinguish between a short-term intraday ripple and a multi-year secular trend.
A single Dow “Primary Trend” is rarely a straight line. It’s usually a complex sequence composed of five distinct Elliott Waves. This “waves within waves” concept is what we call fractal geometry. It explains why a daily chart might look bullish while a weekly chart suggests a larger correction is looming. Understanding these layers is crucial for any trader who wants to move beyond basic trend following. If you’re interested in mastering these complex structures, the Elliott Wave school offers a structured curriculum to help you visualize these patterns in real-time.
Perhaps the most significant difference in the Elliott Wave vs Dow Theory comparison is the use of Fibonacci ratios. Dow Theory relies on price confirmation and volume, but it doesn’t offer specific price targets. Elliott Wave uses the Golden Ratio (1.618) and other Fibonacci levels to forecast where a wave is likely to terminate. In the 2026 trading environment, where high-frequency algorithms dominate the tape, these levels are more relevant than ever. Many modern systems are programmed to respect these mathematical boundaries, making the ability to project targets a vital skill. You can begin tracking these levels yourself by viewing our market analysis charts.
Both systems agree that markets move in recognizable patterns and that price reflects collective human psychology. However, when we examine Elliott Wave vs Dow Theory side-by-side, the primary distinction lies in the timing and depth of the analysis. Dow Theory functions primarily as a lagging indicator. It requires the market to establish a clear trend through a series of higher highs and higher lows before a signal is generated. In contrast, Elliott Wave is a predictive framework. It uses the internal geometry of a move to forecast where it might end before the reversal actually begins.
The “Confirmation” rule also differs significantly between the two. Dow requires multiple averages, such as Industrials and Transports, to move in tandem to validate a trend. Elliott Wave doesn’t look for external confirmation. Instead, it requires the internal wave structure to follow specific mathematical rules. If the internal subdivisions of a move don’t match the expected count, the practitioner knows the current interpretation is likely incorrect. This internal logic provides a level of autonomy that traditional Dow Theory lacks.
Dow Theory is excellent at telling you that the primary trend is bullish, but it doesn’t offer much insight into how far that trend has progressed. You might enter a trade just as the “public participation” phase is reaching its peak. Elliott Wave provides the missing granularity. By identifying a “Wave 5” exhaustion pattern, a trader knows that the trend is likely nearing its conclusion, even if price is still making new highs. The primary difference is identification vs. forecasting.
Risk management is where these two theories diverge most sharply. Dow Theory typically waits for a “lower high and a lower low” to confirm a bear market. While this is a safe approach, it often means giving back a large portion of profits before exiting. Elliott Wave practitioners look for a “five-wave move” in the opposite direction. This impulsive structure serves as an early warning signal, often appearing long before Dow’s traditional confirmation rules are met.
This precision offers a clear “Stop Loss” advantage. Elliott Wave has rigid rules; for example, Wave 2 can never retrace more than 100% of Wave 1. If price hits that level, your count is objectively wrong and you exit the trade. Dow Theory is more subjective, often leaving traders wondering if a “secondary trend” or a total reversal. In 2026, where digital currencies have validated classic 5-wave motive phases, this structural clarity is indispensable for navigating high-velocity markets. To execute these strategies with precision, traders often utilize the specialized account tiers and multi-asset infrastructure offered by TradingPRO.
Combining these two methodologies allows you to move from general market awareness to precise execution. While many traders view Elliott Wave vs Dow Theory as an “either-or” debate, the most successful practitioners use them as complementary layers. By using Dow Theory to define the broad environment and Elliott Wave to time the specific entry, you create a robust system that accounts for both macro trends and micro structures. This multi-timeframe approach reduces the risk of being caught on the wrong side of a major trend change.
Your analysis should always begin with the highest timeframe possible. Start by identifying the Dow Primary Trend on a weekly or monthly chart. If the broad market is in a distribution phase, attempting to trade a bullish wave count on a lower timeframe is statistically dangerous. You should never trade an Elliott Wave count that contradicts the Dow Primary Trend. Instead, look for the “Accumulation” phase in Dow’s model, which typically aligns with the start of an Elliott Wave 1. This synergy provides the conviction needed to hold a position through early volatility. To protect your trades during these transitions, implementing a structured Elliott Wave risk management strategy is essential for capital preservation.
Once the macro direction is clear, zoom in to the daily or four-hour chart to identify the specific wave count. The goal is to use the “Wave 3” surge to capitalize on what Dow called the “Public Participation” phase. This is where the strongest price action occurs. Conversely, you can trade “Wave 4” corrections by applying Dow’s secondary trend principles, looking for price to find support at previous structural levels. If you want to refine your ability to spot these setups, consider enrolling in a wave theory trading course to master the nuances of wave personality. You can start applying these techniques today by accessing our Free Charts to see how these theories overlap in real-time.
To build a consistent workflow, follow these five steps for every trade setup:
This integrated approach minimizes the “lag” inherent in traditional technical analysis. It allows you to anticipate turns rather than just reacting to them. By the time a Dow Theory reversal is confirmed by a lower low, an Elliott Wave practitioner has likely already exited near the top of Wave 5. This is the ultimate advantage of understanding the structural relationship between Elliott Wave vs Dow Theory in the 2026 markets.
Mastering the theoretical differences of Elliott Wave vs Dow Theory is a vital first step, but the true test lies in live market application. In 2026, the interconnected nature of global indices and digital currencies requires a more sophisticated approach than simple trend following. Wavetraders serves as the essential bridge between these two schools of thought. We provide practitioners with professional-grade wave counts and structural analysis for FX, indices, and digital currencies. This ensures you aren’t just following the tide, but tracking every individual wave within it.
Our FX and Digital Currency services are built for the modern environment where volatility is the norm. We provide daily updates and live webinars to help you navigate intra-day price action without losing sight of the macro count. This expert guidance is designed to prevent the common pitfalls beginners face, such as over-leveraging during a “Wave 4” correction or missing the start of a “Wave 3” surge. If you’ve developed a consistent edge and are looking for professional backing, our funded trader program offers the resources needed to manage prop capital effectively.
Education is the cornerstone of our community. The Elliott Wave School provides a logical progression from beginner basics to advanced technical mastery. We focus on teaching you how to recognize complex patterns like triangles and flats through high-definition video lessons and real-world examples. This structured approach helps you develop the quiet confidence needed to trade independently. For those ready to transition from basic counting to institutional-grade analysis, our Elliott Wave advanced course provides the deep-dive expertise required for professional success.
Beyond the charts and lessons, the value of expert feedback cannot be overstated. Trading often feels like a solitary pursuit, but at Wavetraders, you’re part of a community of like-minded practitioners. Engaging with professional counts and receiving feedback on your own analysis significantly accelerates the learning curve. By tracking the markets together, we move from the academic comparison of Elliott Wave vs Dow Theory into a practical, results-driven reality.
Understanding the relationship between Elliott Wave vs Dow Theory is about more than just academic curiosity. It’s about building a practical framework that identifies the macro tide while mapping the individual waves within it. You’ve seen how Dow Theory provides the essential foundation for trend identification, while Elliott Wave offers the granularity needed to anticipate reversals before they occur. By integrating these two schools of thought, you reduce the reliance on lagging indicators and gain a clearer view of where price is likely to go next.
The transition from a basic trend follower to a professional wave practitioner requires patience and consistent application. With over 20 years of market education expertise, we help you bridge this gap by providing real-time analysis across FX, Crypto, and Commodities. Our expert guidance reduces the subjectivity of wave counting, giving you the confidence to execute trades in volatile environments. It’s time to move beyond the surface of price action and master the underlying structure of the markets.
Join Wavetraders and Master Elliott Wave Analysis Today. We look forward to tracking the markets together and helping you achieve your trading goals in 2026.
One isn’t necessarily superior; they function as different layers of market analysis. Dow Theory acts as the foundational bedrock for identifying macro trends, while Elliott Wave provides the granular detail needed for precise execution. Most professionals view the Elliott Wave vs Dow Theory relationship as a logical progression. You use Dow’s principles to find the general market direction and then apply wave counting to find the specific trade setup.
Integrating both is the most effective way to navigate the 2026 markets. This Elliott Wave vs Dow Theory integration allows you to use Dow’s primary trend to establish a bias on a weekly chart and then use the Elliott Wave School curriculum to learn how to count internal waves on a daily chart. This combination ensures you don’t fight the major tide while seeking high-probability entries. It balances macro context with micro precision.
Dow Theory is considered lagging because it requires confirmation from multiple averages and the establishment of a “lower high and lower low” to signal a trend change. By the time these conditions are met, a large portion of the move is over. Elliott Wave is more predictive. It identifies specific exhaustion patterns, like a completed Wave 5, allowing you to anticipate a reversal before the price action confirms it through traditional rules.
The most critical rule is that Wave 3 can never be the shortest of the three impulse waves. Beginners often miscount by labeling a small move as Wave 3. If your count shows Wave 3 as the shortest, your interpretation is objectively wrong. Mastering this rule helps eliminate common errors and protects your capital. It’s the first thing we teach students to look for when they start counting waves.
Basic concepts can be grasped in a few weeks, but mastery takes several months of practice. Most students at the Elliott Wave School find that after three to six months of daily application and expert guidance, they can identify primary patterns with confidence. The learning curve is steep, but the ability to read market structure independently is a permanent asset. It’s about developing the eye for pattern recognition over time.
It does, though the high-velocity nature of digital assets requires adaptation. The principle that the market discounts everything was clearly visible in Bitcoin’s 2025 cycle. While Dow’s three phases still occur, they happen much faster than in traditional equities. Using our Digital Currency Service helps you see how these theories function in the crypto environment. It proves that human psychology remains consistent, regardless of the asset class being traded.
The three phases are accumulation, public participation, and distribution. Accumulation happens when informed investors buy while sentiment is still negative. Public participation is the long trend that attracts the majority of market participants. Distribution occurs when early buyers sell to latecomers. These phases align perfectly with the motive sequences we track. Understanding these stages helps you avoid the common mistake of buying at the very end of a distribution phase.
Fibonacci ratios provide the mathematical targets for wave terminations, which adds a layer of precision missing from Dow Theory. For instance, Wave 3 often travels 1.618 times the length of Wave 1. By using an Elliott Wave Calculator, you can project these levels with accuracy. In 2026, where algorithms dominate the tape, these mathematical clusters often act as magnets for price action and institutional liquidity across all timeframes.
DISCLAIMER
Any reviews, news, analysis, prices or other information contained on our website is provided as general market commentary and delivered electronically through a distribution channel to larger number of clients, therefore does not constitute investment advice or investment research. We are not trading advisors. Most of our work is for educational purposes only, with information based on Elliott Wave theory in real time. Trading forex, futures, options, stocks, cryptocurrenices or any another trading market carries a high level of risk, and may not be suitable for all investors.
The possibility exists that you could lose some or all of your initial investment; therefore you should not invest money that you cannot afford to lose. Our website and the information that we provide should not be relied upon as a substitute for extensive independent research before making your investment decisions. In no event will we be liable for any loss or damage on your account in connection with, the use of our products. For any real cash investments you have to contact your financial advisor.
Any information or material contained on our website is owned by Val Global d.o.o.. Reproduction is prohibited without Val Global d.o.o. prior license in writing.
By continuing to use the site, you agree to the use of cookies. Learn more.
The cookie settings on this website are set to "allow cookies" to give you the best browsing experience possible. If you continue to use this website without changing your cookie settings or you click "Accept" below then you are consenting to this.