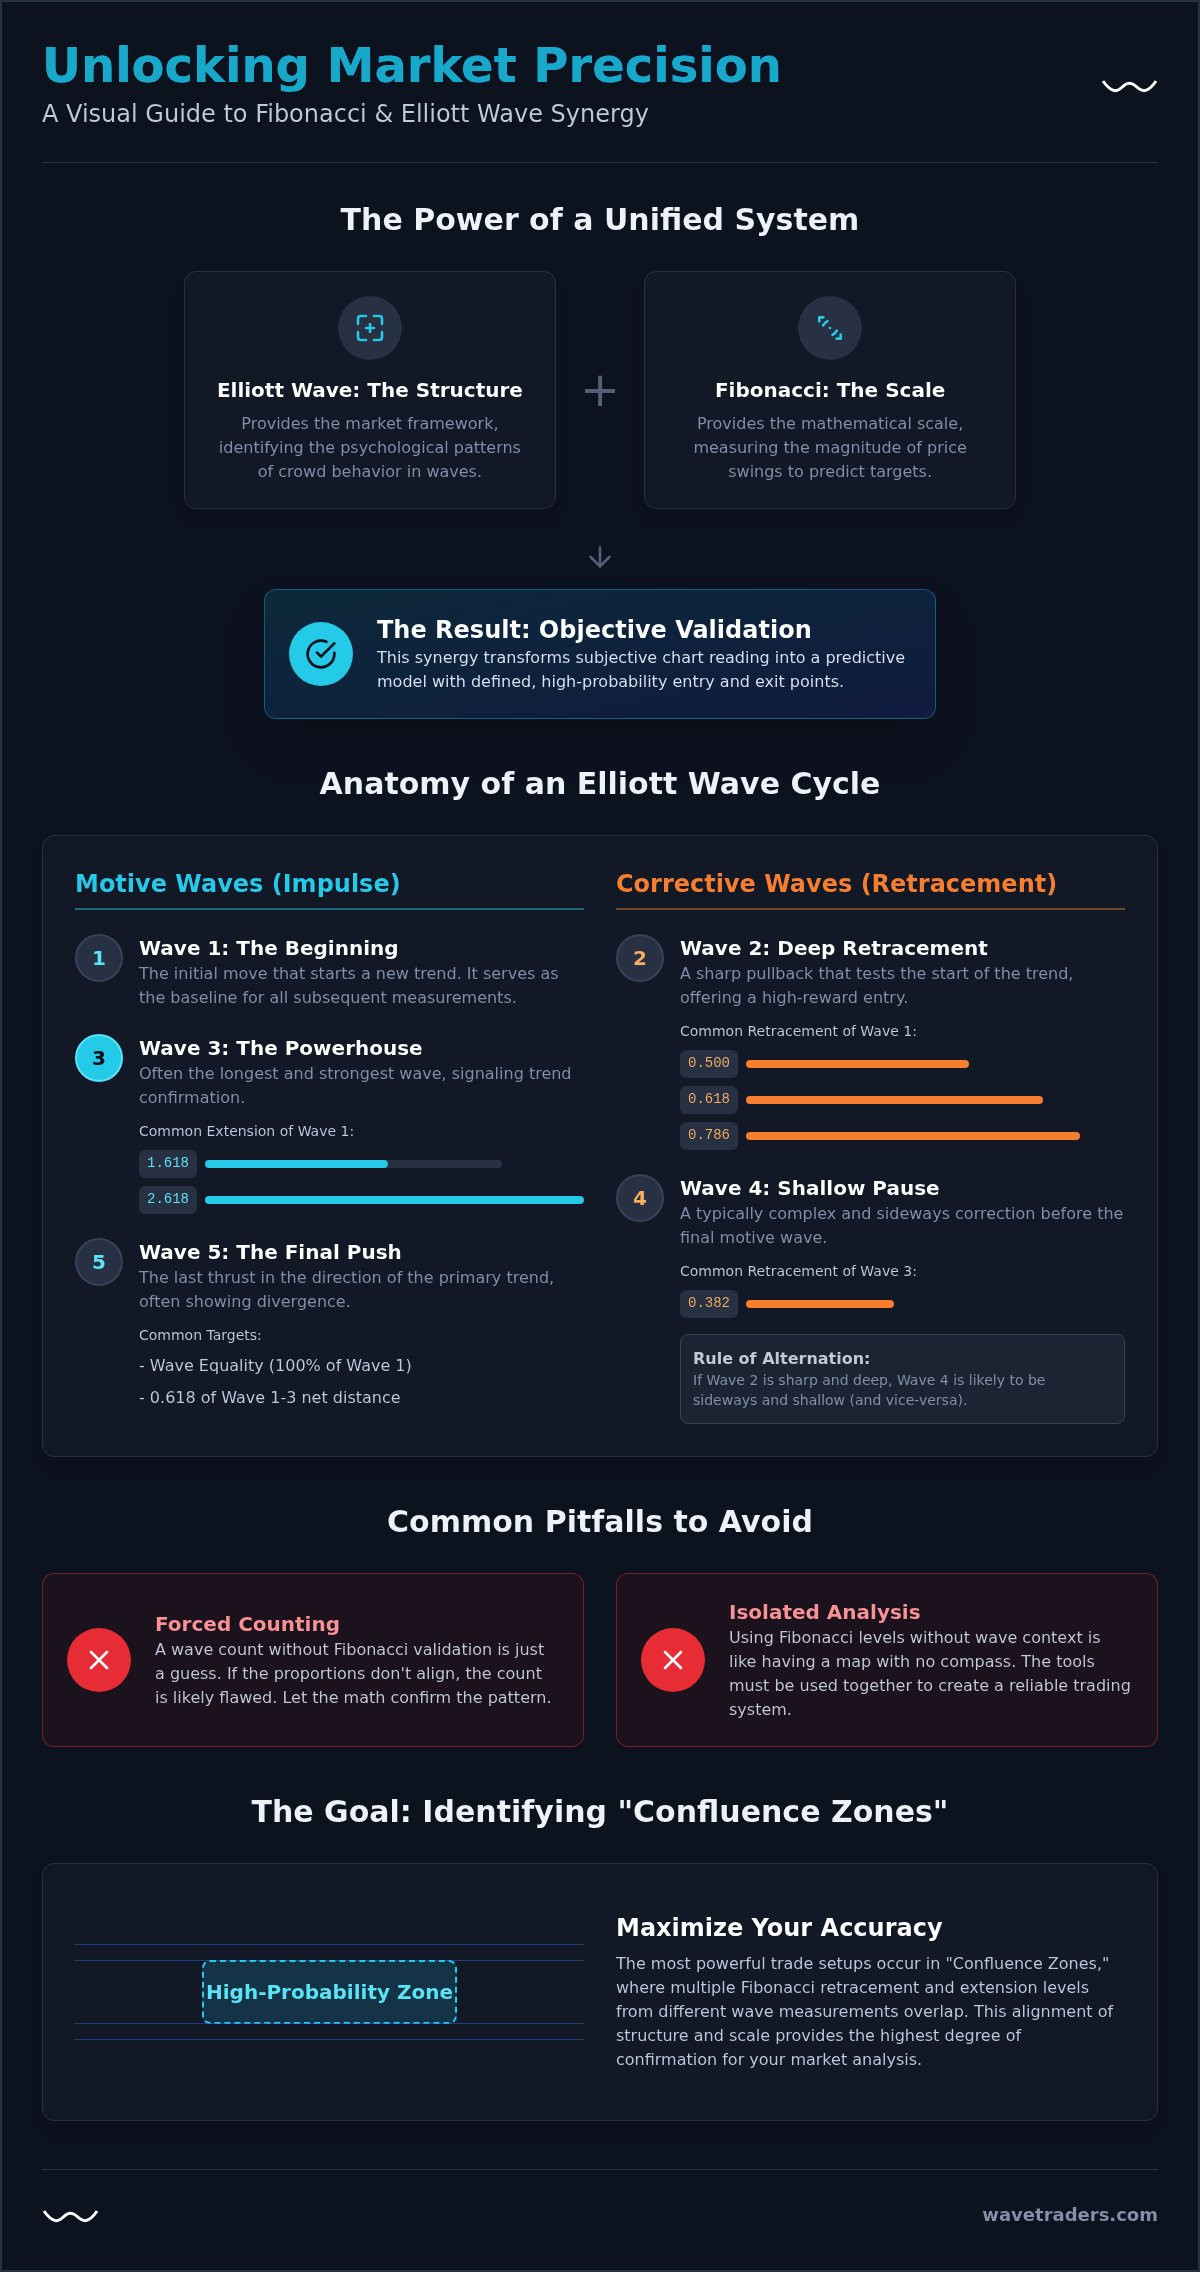
Fibonacci ratios are not just arbitrary price levels on a chart; they are the mathematical validation of an Elliott Wave count. Without this mathematical confluence, a wave count is often little more than a subjective guess. Mastering Fibonacci Elliott Wave trading is the key to moving past the guesswork that leads to analysis paralysis.
If you’ve ever felt the frustration of entering a correction too early or missing the heart of a trend because of unclear targets, you understand how vital objective confirmation is for your performance. We agree that the markets can feel chaotic without a structured lens. This guide provides a clear roadmap for pairing these two powerful tools to identify high-probability setups and precise market targets. We’ll examine the specific ratios that define each wave and how to use tools like our Elliott Wave Calculator to simplify your analysis. By the end of this article, you’ll have a systematic approach to market structure that lowers entry stress and improves your predictive accuracy for 2026.
Successful market analysis requires both a framework and a measurement system. In the context of Fibonacci Elliott Wave trading, the Elliott Wave Principle provides the essential market structure, while Fibonacci ratios provide the precise scale. Think of Elliott Wave as the blueprint of a building and Fibonacci as the tape measure that ensures every beam is the correct length. R.N. Elliott observed that financial markets are fractal, meaning patterns repeat across different timeframes. He concluded that these patterns naturally align with the Golden Ratio because they reflect the ebb and flow of collective human psychology.
A wave count that lacks Fibonacci proportion is often a warning sign of an incorrect analysis. This is what we call the “Validation Rule.” If a supposed Wave 3 doesn’t reach a typical extension level, or a Wave 2 retracement is shallow without a clear reason, the count is likely flawed. By requiring mathematical confluence, you significantly reduce the subjectivity that often leads to analysis paralysis. Instead of wondering if a trend has ended, you look for “hard” price targets that offer objective confirmation. This pairing transforms a series of squiggly lines into a predictive model with defined boundaries.
The mathematical foundation of this synergy lies in the 1.618 ratio, known as Phi, and its inverse, 0.618. These numbers aren’t just curiosities; they manifest in the way traders react to price movement. During a bull cycle, the 1.618 extension often marks where greed reaches a temporary exhaustion point. Conversely, the 0.618 retracement represents the level where fear subsides and buyers return to the market. While other levels like 0.382 and 0.50 are also relevant, the Golden Ratio acts as the balancing point of market momentum.
Many participants struggle because they use these tools in isolation. Using “naked” Fibonacci levels without market context is dangerous because a 0.618 level means very little if you don’t know which wave you’re currently in. Similarly, “blind” wave counting that ignores price proportions often leads to forced interpretations that the market eventually invalidates. When you pair them together, you create a double-check system for every trade entry. Every position is supported by both a structural pattern and a mathematical probability, which is the cornerstone of a professional Fibonacci Elliott Wave trading strategy. This integrated approach is a core focus for those moving from basic theory to real-time application.
Financial markets don’t move in straight lines; they expand and contract in a five-wave impulse sequence governed by specific mathematical relationships. Understanding these proportions is what separates professional Fibonacci Elliott Wave trading from amateur charting. The structure isn’t random. It reflects the expansion of price based on documented Fibonacci Setups in Wave Analysis. By applying these ratios, you can transform a subjective count into a high-probability forecast.
Wave 3 is typically the most powerful phase of a trend. Traders look for this wave to reach the 1.618 or 2.618 extension of Wave 1. These are the “power zones” where momentum is at its peak. If a market is in a parabolic state, you might even see “Extended Waves” reaching the 4.236 multiple. Once Wave 3 completes, we look toward Wave 5 for the final push. This wave often achieves “Wave Equality” with Wave 1, meaning it matches the price distance of the first wave. Alternatively, it often reaches a 0.618 extension of the net distance from the start of Wave 1 to the end of Wave 3. These targets provide clear exit points before a major correction begins.
Corrective waves offer the most strategic entry points, but they require patience. Wave 2 typically retraces deeply, often finding a floor between the 0.50 and 0.786 levels of Wave 1. This happens because many participants still believe the previous trend is intact. Wave 4 is different. It’s usually a shallow retracement, often stalling at the 0.382 level. This behavior follows the “Rule of Alternation.” If Wave 2 was a sharp, deep drop, Wave 4 will likely be a sideways, complex pattern. When these corrections become non-linear, applying Elliott Wave triangle rules helps you identify the exact point where the consolidation should end.
Calculating these levels manually across various instruments can lead to errors. We recommend using our Elliott Wave Calculator to automate these projections. It simplifies the math, letting you focus on the broader market context. If you’re looking to refine your entries, our FX Service provides real-time examples of these ratios in action across major currency pairs, helping you see these mathematical foundations as they develop.
To succeed in Fibonacci Elliott Wave trading, you must understand the distinct roles of retracements and extensions. Retracements act as your map for high-probability entries, while extensions provide the coordinates for your exits. Many traders get these tools confused, leading to entries that are too early or exits that leave profit on the table. By differentiating between the two, you can build a strategy that respects the market’s natural rhythm of expansion and contraction.
Professional analysis often relies on “Cluster Analysis.” This involves looking for “Confluence Zones” where Fibonacci levels from different wave degrees align at a single price point. For instance, a Wave 4 retracement level might overlap with a Wave 1 extension target. When these levels cluster together, the probability of a market turn increases significantly. You can see this methodology applied in our Elliott Wave forex trading examples, where we track these clusters across major and minor currency pairs in real-time.
Retracements measure the depth of a correction against the previous motive move. In 2026, the “Golden Pocket”, the narrow zone between the 0.618 and 0.65 levels, has become the primary area of interest for institutional and retail traders alike. Identifying the end of a corrective Wave 2 or Wave 4 within this pocket offers a low-risk entry point. To protect your capital, it’s a standard practice to set stop-losses just beyond the next major Fibonacci level, such as the 0.786 or 1.00. This approach ensures your risk remains defined while you wait for the next impulsive wave to confirm your count.
Extensions are used to project where the next impulsive move will likely exhaust itself. Projecting the end of Wave 3 is critical for capturing the largest portion of a trend. We often look at the 1.618 extension as a primary target for Wave 3, though strong trends may reach the 2.618 level. In corrective patterns, the 1.00 extension is used to identify “Measured Moves” in ABC zig-zags, where Wave C equals the length of Wave A. While theory is helpful, an Academic Study on Elliott Wave Profitability suggests that the consistent application of these mathematical targets is what drives long-term success. Scaling out of positions as price hits sequential Fibonacci targets allows you to lock in gains while keeping a portion of the trade open for potential extensions.
The transition from theoretical knowledge to consistently profitable Fibonacci Elliott Wave trading is often where many traders stumble. The most common pitfall is “Forced Counting,” where a trader decides on a market direction first and then tries to bend the Fibonacci levels to fit that bias. This emotional attachment to a specific outcome leads to ignoring the “Higher Degree” trend. For instance, a 0.618 retracement in a minor wave will rarely hold if the primary trend is a powerful bear market. Context always overrules a single price level.
Another hurdle is the “Spaghetti Chart” syndrome. It’s tempting to draw every possible retracement and extension across multiple timeframes, but this often results in a screen obscured by dozens of lines. When your chart is too cluttered, it becomes impossible to see the underlying price action. Clarity is a prerequisite for confidence. If you find yourself overwhelmed by a count that has been breached, it’s time to pivot to strict Elliott Wave risk management to protect your capital while you reassess the structure.
A professional uses Fibonacci ratios to disprove their count rather than just trying to prove it. If price slices through a 0.786 level without hesitation, it’s a clear signal that your current wave count is likely incorrect. Every setup must have a defined “Invalidation Level.” This is the price point where the pattern you’re tracking is mathematically impossible. Maintaining multiple “Alternate Counts” isn’t a sign of indecision; it’s a sign of maturity. It means you’re prepared for whatever the market does next, rather than being married to a single perspective. Mastering the psychological side of Fibonacci Elliott Wave trading requires a shift from seeking certainty to managing probability.
Markets are messy. In the high-volatility environment of 2026, price often “front-runs” a level by a few pips or “overshoots” it before reversing. Waiting for the market to hit a Fib level to the exact penny is a recipe for missed opportunities. Instead, use the Fibonacci zone as a point of interest and look for price action triggers, such as candlestick reversal patterns, to confirm the turn. This patience is difficult but necessary. If you’re struggling with the complexity of these market movements, our Elliott Wave School provides the structured environment needed to master these nuances.
Moving from a static chart to a live market environment is the most challenging step for any analyst. It is one thing to identify a perfect 0.618 retracement on a historical chart; it is quite another to execute a trade while the candles are still forming. Success in Fibonacci Elliott Wave trading requires a transition from observing patterns to anticipating them. This shift happens through deliberate practice and the use of a consistent framework that removes emotional decision-making from the process.
For those looking to sharpen their skills, the S&P 500 Elliott Wave charts offer an ideal training ground. The high liquidity and institutional participation in this index ensure that the waves often adhere to classic Fibonacci proportions with remarkable consistency. By tracking a major index, you learn to see the rhythm of the market across multiple timeframes. To maintain discipline, we recommend building a checklist for every trade:
The math behind the waves can feel daunting at first, which is why our Elliott Wave School focuses on practical application. We believe that seeing how Fibonacci levels are drawn in real-time is far more valuable than reading about them in a textbook. Our video lessons allow you to follow along as we identify setups, helping you move from a beginner who recognizes patterns to a practitioner who can trade them. Within our community, you can share your counts and receive feedback from seasoned traders, which is the fastest way to refine your perspective and build confidence.
We suggest starting with a single, liquid market like EUR/USD or Bitcoin to master the specific rhythm of that instrument. Once you have demonstrated consistency in your analysis, you may find that capital is your only remaining hurdle. Our Funded Trader Program is designed for analysts who have mastered the pairing of Fibonacci and Elliott Wave but need the resources to scale their operations. The markets in 2026 will continue to offer opportunities for those who are prepared. We invite you to join Wavetraders to track the 2026 market cycles with us and turn this comprehensive theory into a dynamic, professional strategy.
Mastering Fibonacci Elliott Wave trading is about more than just drawing lines on a chart; it’s about developing a deep understanding of market geometry and investor psychology. We’ve explored how Fibonacci ratios provide the objective validation needed to confirm your wave counts, helping you avoid the subjectivity that often leads to costly errors. By identifying confluence zones where retracements and extensions align, you gain the predictive accuracy required to navigate today’s volatile markets with confidence.
Since 2003, we’ve focused on providing methodical, real-time analysis across FX, Digital Currency, and major Indices. The journey from learning theory to executing dynamic strategies is best taken within a supportive community of experts. If you’re ready to move past analysis paralysis and start identifying high-probability setups with precision, it’s time to take the next step. Master the markets with the Wavetraders Elliott Wave School and join an expert-led trading community dedicated to professional growth. We look forward to tracking the next big market moves together.
Fibonacci Elliott Wave trading is effective for both day trading and swing trading because the patterns are fractal. This means the same mathematical relationships appear on a five-minute chart as they do on a weekly chart. Swing traders typically use these tools to catch major trend moves, while day traders apply them to smaller price fluctuations within the session. Regardless of your timeframe, the core principles of structure and scale remain consistent for any liquid instrument.
The most critical levels are the 0.618 retracement, the 0.382 retracement, and the 1.618 extension. Wave 2 often finds support at the 0.618 level, while Wave 4 typically stalls at the 0.382 level. For profit targets, the 1.618 extension is the standard benchmark for Wave 3. These levels act as the mathematical backbone for your analysis, providing objective areas where market turns or continuations are likely to occur.
Cryptocurrency markets are excellent for this methodology because they are driven by intense collective psychology. Bitcoin and Ethereum frequently follow Fibonacci Elliott Wave trading rules with high precision, as these assets are highly speculative and liquid. The volatile nature of crypto often leads to extended Wave 3 moves, making Fibonacci extensions particularly useful for identifying exhaustion points. This structured approach helps traders stay calm during the rapid price swings common in digital assets.
If price moves beyond the 0.786 retracement level, it serves as a major warning that your current wave count may be incorrect. While a correction can technically retrace up to 99% of the previous wave, a move past 0.786 often suggests the trend has shifted rather than just corrected. If price breaches the 1.00 level, the count is officially invalidated. Professional analysts use these deep levels to tighten stop-losses and reassess their structural thesis.
You should use retracements when you are looking for an entry during a corrective phase, such as Wave 2 or Wave 4. These tools measure how much of the previous move has been “given back” by the market. Conversely, use extensions when you are already in a trade and need to identify where an impulsive move like Wave 3 or Wave 5 will end. Retracements find the floor, while extensions find the ceiling.
While you can perform the analysis on basic charting platforms, specialized software can improve your efficiency. Tools like MotiveWave or WaveBasis offer automated pattern recognition and integrated Fibonacci tools designed specifically for this theory. However, many practitioners prefer to draw their own levels manually to develop a better feel for the market. Our Elliott Wave Calculator is also a valuable resource for members to quickly verify their mathematical projections without manual errors.
The 1.618 extension is the most common target for Wave 3, but it is not a guaranteed limit. In powerful bull or bear markets, Wave 3 can easily extend to the 2.618 or even the 4.236 level. You should view the 1.618 as a primary area of interest where you might scale out or tighten stops, but always monitor momentum and price action to see if the trend has more room to run.
The Rule of Alternation suggests that if Wave 2 was a sharp and deep retracement, Wave 4 will likely be a shallow and sideways correction. Mathematically, this means if Wave 2 hit the 0.618 level, you should expect Wave 4 to stall near the 0.382 level. This guideline helps you anticipate the personality of the next correction, allowing you to set more realistic expectations for price depth and the time required for the pattern to complete.
DISCLAIMER
Any reviews, news, analysis, prices or other information contained on our website is provided as general market commentary and delivered electronically through a distribution channel to larger number of clients, therefore does not constitute investment advice or investment research. We are not trading advisors. Most of our work is for educational purposes only, with information based on Elliott Wave theory in real time. Trading forex, futures, options, stocks, cryptocurrenices or any another trading market carries a high level of risk, and may not be suitable for all investors.
The possibility exists that you could lose some or all of your initial investment; therefore you should not invest money that you cannot afford to lose. Our website and the information that we provide should not be relied upon as a substitute for extensive independent research before making your investment decisions. In no event will we be liable for any loss or damage on your account in connection with, the use of our products. For any real cash investments you have to contact your financial advisor.
Any information or material contained on our website is owned by Val Global d.o.o.. Reproduction is prohibited without Val Global d.o.o. prior license in writing.
By continuing to use the site, you agree to the use of cookies. Learn more.
The cookie settings on this website are set to "allow cookies" to give you the best browsing experience possible. If you continue to use this website without changing your cookie settings or you click "Accept" below then you are consenting to this.