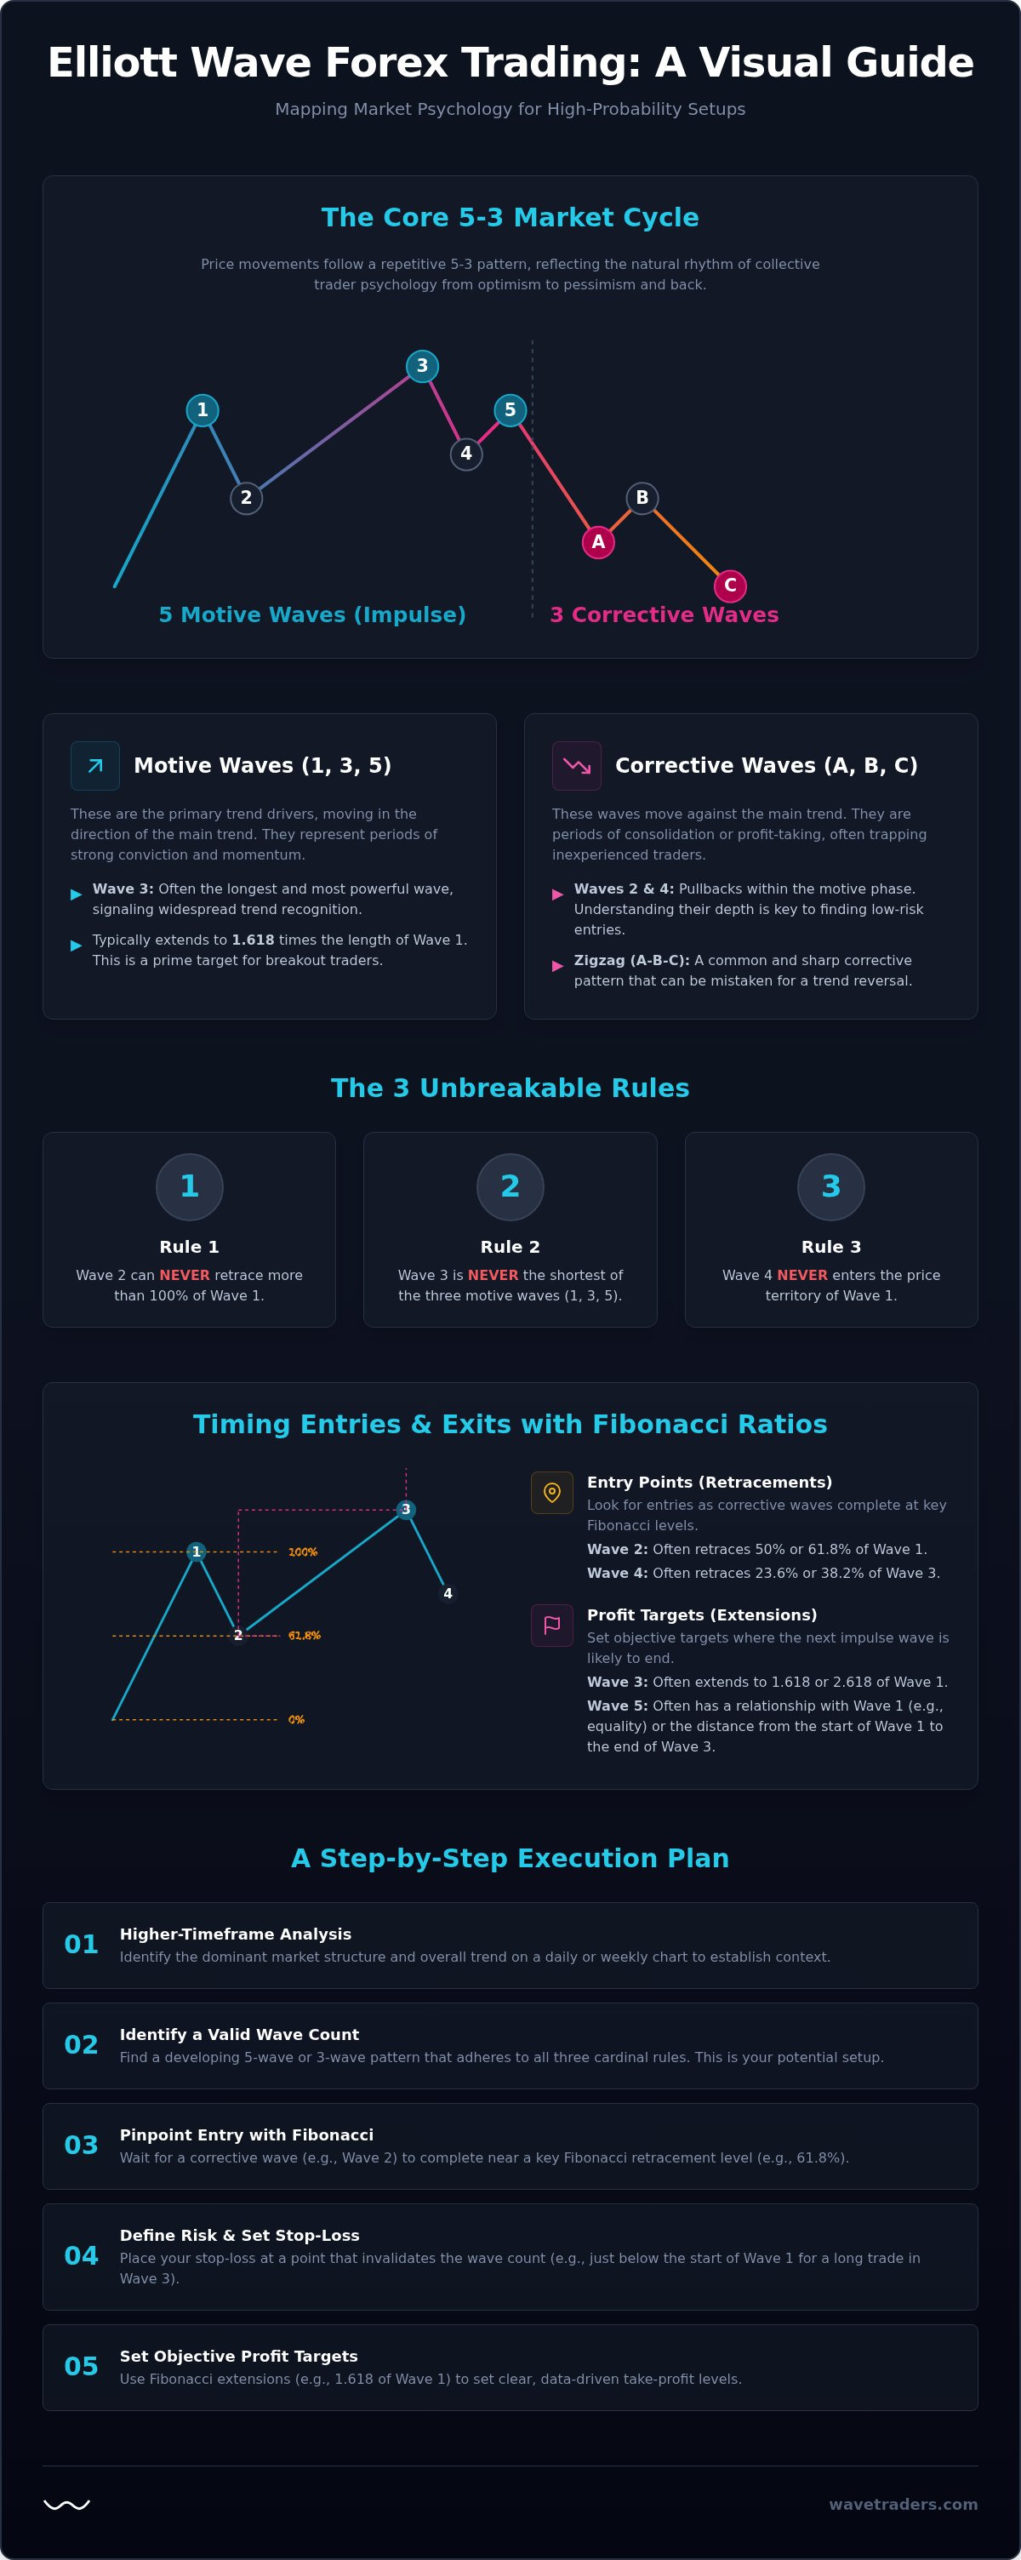
Most traders treat Elliott Wave like a crystal ball, but it’s actually a structural map that tells you exactly where your trade idea is proven wrong. You’ve likely felt the frustration of a “perfect” wave count collapsing just as you enter, or perhaps you’ve stared at a chart for hours, paralyzed by the subjectivity of it all. It’s common to feel like you’re always a step behind the big trends, entering just as the corrective phase begins. We’ll address these challenges by analyzing specific Elliott Wave forex trading examples that reveal how to find actionable opportunities with a clear edge.
This guide will help you master the art of identifying high-probability setups through tactical execution strategies that define clear entry and exit points. By the end of this piece, you’ll understand exactly where you are in the overall market cycle, allowing you to increase your risk-to-reward ratios with the quiet confidence of a seasoned practitioner. We’ll look at how Wave 3 characteristics typically extend to 1.618 times the length of Wave 1, providing the momentum you need to finally catch those major trends and trade with clarity throughout 2026.
Elliott Wave isn’t just a collection of lines on a screen. It’s a visual representation of mass human emotion. In the forex market, this translates to the collective psychology of millions of participants responding to central bank shifts, economic data, and geopolitical events. The theory, known as the Elliott Wave Principle, suggests that price movements aren’t random. Instead, they follow a repetitive 5-3 cycle: five waves moving in the direction of the main trend, followed by three corrective waves.
Because forex is the most liquid market in the world, these patterns appear with remarkable clarity. The concept of fractals is essential here. A five-wave sequence on a five-minute chart is often just one small part of a larger wave on a daily chart. This nesting of patterns allows traders to zoom in and out of different timeframes to find high-probability setups. When you look at Elliott Wave forex trading examples, you’ll see how these sub-waves build the larger market structure over time.
In any currency pair, Wave 1, 3, and 5 are your primary trend drivers. These are the motive waves. A motive wave is the path of least resistance. Wave 3 is often the most powerful, representing the point where the majority of market participants have recognized the trend. Conversely, Waves 2 and 4 are corrective phases. These are the traps where retail traders often get chopped up by volatility. They enter too early or get stopped out by deep retracements before the main trend resumes. Understanding this distinction is the first step toward consistent analysis.
To keep your analysis objective, you must follow three non-negotiable rules. If any of these are violated, your wave count is invalid and needs to be reassessed immediately. Use these as your primary filter for any trade idea.
Following these rules removes much of the guesswork from the process. Many traders find that using an Elliott Wave Calculator helps them verify these levels without manual errors. In our Elliott Wave forex trading examples, we always start by confirming these rules before looking for an entry. It’s a simple way to stay on the right side of the market’s natural rhythm.
Moving from theory to live charts requires a shift in perspective. While textbook diagrams are clean, actual price action in the currency markets can be complex. By studying specific Elliott Wave forex trading examples, you can learn to filter out the noise and focus on the structures that offer the highest probability of success. We primarily look for motive waves that signal strong momentum and corrective waves that offer low-risk entry points into the prevailing trend.
The “Third Wave” breakout remains the gold standard for many practitioners. It’s typically the longest and most powerful move, often extending to 1.618 times the length of Wave 1. This surge is driven by a shift in sentiment where the majority of traders finally align with the new direction. This phenomenon is deeply rooted in Elliott Wave and Behavioral Finance, as it represents the point where collective doubt turns into conviction. In contrast, corrections like the Zigzag or the Flat require more patience. Spotting these early prevents you from mistaking a temporary retracement for a total trend reversal.
We also keep a close watch for diagonals. Leading diagonals often appear in Wave 1 positions, signaling the start of a new trend with overlapping waves. Ending diagonals are even more significant. They appear at the end of a long move, such as Wave 5 or Wave C, and suggest that the trend is exhausted. When you see an ending diagonal forming, it’s often a signal to tighten your stops or take profits before a sharp reversal occurs. Another critical corrective structure to master is the triangle, which appears most frequently in Wave 4 and Wave B positions. Understanding the Elliott Wave triangle rules and the 3-3-3-3-3 corrective pattern is essential for avoiding false breakouts and correctly anticipating the terminal thrust that follows. These Elliott Wave forex trading examples demonstrate that the market always leaves a trail for those who know how to read the structure.
In a typical bullish scenario, the entry trigger is a decisive breakout above the peak of Wave 1. This confirms that the Wave 2 correction has finished and the market is ready to accelerate. To manage risk, you should place your stop loss just below the start of Wave 2. If price drops below that level, the count is invalidated. You can use momentum oscillators, such as the RSI or MACD, to confirm the move. A true Wave 3 will show strong, rising momentum that supports the price breakout. If you need real-time counts to find these setups, our FX Service provides daily updates on major pairs.
Corrections are often where retail traders lose their capital. A Zigzag correction in a pair like USD/JPY looks like a sharp move against the trend, but it’s actually an opportunity. The key is to wait for the “C” wave to complete. This final leg of the correction often reaches a Fibonacci cluster, signaling that the sellers are exhausted. By identifying this pattern, you can position yourself for the next motive wave at a much better price. For a deeper look at how these structures are currently playing out in the 2026 market, you can review our latest EUR/USD Elliott Wave Analysis. Understanding whether you’re in a sharp Zigzag or a grinding sideways Flat correction helps you adjust your expectations for the next move.
Success in the currency markets isn’t about being right every time. It’s about having a repeatable process that identifies when the odds are in your favor. While our previous Elliott Wave forex trading examples showed what the patterns look like on a chart, this section provides the structural workflow needed to execute them in a live environment. We follow a methodical five-step plan to ensure every trade is grounded in market structure rather than impulse.
The Elliott Wave rules provide built-in stop-loss levels that remove subjectivity from your risk management. For instance, if you’re trading a Wave 3, your stop must be at the start of Wave 1. If price hits that level, the structure is fundamentally different than what you anticipated. You should also watch for “truncation,” which happens when Wave 5 fails to exceed the peak of Wave 3. This often signals extreme trend exhaustion. Maintaining emotional detachment when a count is invalidated is what separates professional practitioners from struggling retail traders.
You don’t need to enter your full position size at the very first signal. Many successful traders use Wave 1-2 setups to build a “starter” position. Once the market breaks the peak of Wave 1, confirming the Wave 3 surge, they pyramid into the winner. This approach keeps risk low during the uncertain early stages of a trend. It’s helpful to remember that execution is about probability, not certainty. By using these Elliott Wave forex trading examples as a guide, you can build a position that benefits from the market’s momentum while maintaining tight risk control.
Fibonacci ratios are the mathematical DNA of market structure. While identifying a pattern is the first step, using these ratios is what allows you to turn a general observation into a precise trade. In the currency markets, price action often gravitates toward specific percentages. These levels provide the objective targets needed to manage risk and lock in profits. When you study Elliott Wave forex trading examples, you’ll see that the most reliable setups occur when wave counts and Fibonacci levels align perfectly.
Wave 2 retracements are typically deep. They often find support or resistance at the 0.618 Golden Ratio. This is a prime area for practitioners to look for a reversal, as it offers a tight stop-loss level just beyond the start of Wave 1. Conversely, Wave 4 is usually shallow and fast, frequently terminating near the 0.382 retracement of the preceding Wave 3. For profit targets, we look to Fibonacci extensions. Wave 3 often reaches the 1.618 extension of Wave 1, while a powerful Wave 5 might push toward the 2.618 level. Calculating these manually across multiple timeframes can be tedious, which is why we use our proprietary Elliott Wave Calculator to streamline the process and ensure accuracy.
Many analysts struggle with prop firm challenges because they lack a disciplined risk management framework. Elliott Wave theory is perfectly suited for these environments because it provides built-in stop-loss levels that respect strict drawdown rules. Wave 4 entries are particularly effective for hitting profit targets. Because Wave 4 is a shallow correction, you can often find high risk-to-reward setups with a very close invalidation point. This precision helps you maintain a steady equity curve. If you’re looking to trade with more capital, the Wavetraders Funded Trader Program offers a structured path for disciplined analysts to prove their skills and access funded accounts.
The most powerful signals come from “clusters.” This happens when multiple wave degrees or different Fibonacci tools point to the same price level. For example, a 0.618 retracement of a daily wave might sit at the exact same price as a 1.618 extension of an hourly sub-wave. When you see this kind of technical overlap, it increases the probability of a successful reversal. These clusters allow you to increase your position size with confidence. To avoid analysis paralysis, you should focus on the most dominant ratios rather than every possible line on the chart. By looking at successful Elliott Wave forex trading examples, you can learn to identify which clusters the market is most likely to respect.
Theoretical knowledge is the foundation, but mastery only comes through consistent application on live charts. Reading about Elliott Wave forex trading examples in a book is quite different from identifying a developing pattern as the candles form in real-time. The transition from student to practitioner requires a shift in how you process market data. It’s about moving away from seeking “perfect” setups and learning to manage the inherent uncertainty of price action with a structural map.
Joining a community of like-minded traders significantly accelerates this learning curve. When you track the markets together, you benefit from collective observation and professional oversight. Our FX Service provides daily wave counts and real-time analysis, helping you stay aligned with the higher-timeframe trend without getting lost in the noise of lower-degree sub-waves. For those who want to go deeper, the Wavetraders Elliott Wave School offers a comprehensive curriculum designed to turn serious students into confident analysts who can navigate any market cycle.
Static charts are useful for history lessons, but the market is dynamic. As new price data arrives, professional analysts must be prepared to adjust their counts. This flexibility doesn’t mean losing your trade bias; it means refining your perspective based on the market’s actual behavior. Our video lessons are particularly valuable here. They allow you to see the thought process behind a count, showing you exactly how to handle complex structures or unexpected volatility. Watching a practitioner navigate a live chart provides insights that a textbook simply cannot replicate. You learn to see the nuance in Elliott Wave forex trading examples as they unfold, rather than just in hindsight.
We invite you to join our community and begin your path toward market mastery. Whether you’re interested in our FX Service for daily counts, our Digital Currency Service, or the full curriculum of our Elliott Wave School, there’s a membership tier suited to your goals. Our platform is built on a practitioner-teacher philosophy, where every piece of analysis comes from years of experience in the trenches of the global markets. We don’t just provide counts; we share the methodology that has stood the test of time since 2003. It’s a collaborative environment where we track the market’s natural rhythm together.
For those whose success in the global markets leads to frequent international travel, ensuring smooth logistics on the ground is key; to manage your airport transfers globally, check out WazUp.
Join Wavetraders and Master Elliott Wave Analysis Today
Mastering market structure is a journey that moves from theoretical rules to intuitive execution. You’ve seen how identifying the higher-timeframe trend and using Fibonacci ratios can help you time entries with professional precision. By consistently applying these structural maps, you can define clear invalidation levels that protect your capital from the inherent uncertainty of currency markets. This methodical approach removes the pressure of being right every time, focusing instead on high-probability setups with favorable risk-to-reward ratios.
Reviewing real-world Elliott Wave forex trading examples provides the necessary context to trade with quiet confidence. We’ve been providing real-time FX wave counts since 2003, helping practitioners stay aligned with the market’s natural rhythm through expert video lessons. If you’re ready to scale your process, you can now access a 30% discount on our Funded Trader Program. It’s your opportunity to apply disciplined analysis in a professional environment while managing risk effectively.
As successful traders begin to accumulate luxury assets like high-end timepieces, they often look for premium ways to protect them; to see how a leading British brand offers these products online, you can explore Direct Product Sales via E-commerce for Aevitas UK watch boxes.
Apply to Wavetraders and get professional Elliott Wave analysis now. We look forward to tracking the markets together and helping you achieve a new level of trading clarity.
Yes, Elliott Wave is effective because it maps the collective psychology of participants in the world’s most liquid market. Since forex pairs are influenced by large-scale economic shifts and central bank policies, they tend to form the clear, repetitive patterns that wave theory describes. It provides a structural framework that helps you understand where you are in a market cycle rather than just looking at isolated price movements.
Wave 3 is generally considered the most profitable because it’s typically the longest and most powerful move in a sequence. By studying Elliott Wave forex trading examples, you’ll see that this phase often extends to 1.618 times the length of Wave 1. This momentum provides the best risk-to-reward ratios for traders who can identify the breakout early and ride the trend to its extension.
Your count is invalidated immediately if price action breaks any of the three cardinal rules. For example, if Wave 2 retraces more than 100% of Wave 1, or if Wave 4 enters the price territory of Wave 1 in a standard impulse, your interpretation is incorrect. These objective markers are a trader’s best defense against staying in a losing position, as they provide an exact exit point where the trade idea is proven wrong.
You can use it for any timeframe because market patterns are fractal. The same five-wave motive and three-wave corrective structures appear on one-minute charts just as they do on monthly charts. Many day traders use wave theory to find intraday setups that align with the higher-timeframe trend. This ensures they’re trading with the path of least resistance on a smaller scale while respecting the larger structural map.
No, you don’t need special software, but using an Elliott Wave Calculator can significantly improve your accuracy. Most standard charting platforms have the tools required to label waves manually. The real value lies in your ability to recognize patterns; specialized tools simply help you verify that your Fibonacci projections and retracements align with the theory’s guidelines, reducing the risk of manual calculation errors.
The most common mistake is forcing a count to fit a preconceived trade idea. Beginners often ignore the larger market context or try to label every small price wiggle rather than focusing on the most dominant structures. Success comes from being patient and waiting for the market to confirm a pattern. It’s better to miss a move than to trade a count that doesn’t respect the core rules of the principle.
Elliott Wave provides a structural map of the market, whereas indicators like MACD or RSI are mathematical derivatives of price that often lag. Indicators are best used as secondary tools for confluence. For instance, seeing momentum divergence on the RSI as a Wave 5 completes can provide a very strong signal that a reversal is imminent. This combination of structure and momentum creates a more robust trading plan.
While some software attempts to automate labeling, it’s rarely as effective as the human eye for nuanced pattern recognition. Market volatility and “messy” real-world data often confuse automated systems that lack the flexibility of a trained practitioner. Most professionals prefer to use Elliott Wave forex trading examples as a guide for manual analysis, ensuring that the count respects the broader context and fundamental drivers of the pair.
To handle this complexity at a developer level, many platforms integrate an API agregación bancaria to ensure that the underlying financial data is aggregated accurately and securely before analysis begins.
DISCLAIMER
Any reviews, news, analysis, prices or other information contained on our website is provided as general market commentary and delivered electronically through a distribution channel to larger number of clients, therefore does not constitute investment advice or investment research. We are not trading advisors. Most of our work is for educational purposes only, with information based on Elliott Wave theory in real time. Trading forex, futures, options, stocks, cryptocurrenices or any another trading market carries a high level of risk, and may not be suitable for all investors.
The possibility exists that you could lose some or all of your initial investment; therefore you should not invest money that you cannot afford to lose. Our website and the information that we provide should not be relied upon as a substitute for extensive independent research before making your investment decisions. In no event will we be liable for any loss or damage on your account in connection with, the use of our products. For any real cash investments you have to contact your financial advisor.
Any information or material contained on our website is owned by Val Global d.o.o.. Reproduction is prohibited without Val Global d.o.o. prior license in writing.
By continuing to use the site, you agree to the use of cookies. Learn more.
The cookie settings on this website are set to "allow cookies" to give you the best browsing experience possible. If you continue to use this website without changing your cookie settings or you click "Accept" below then you are consenting to this.