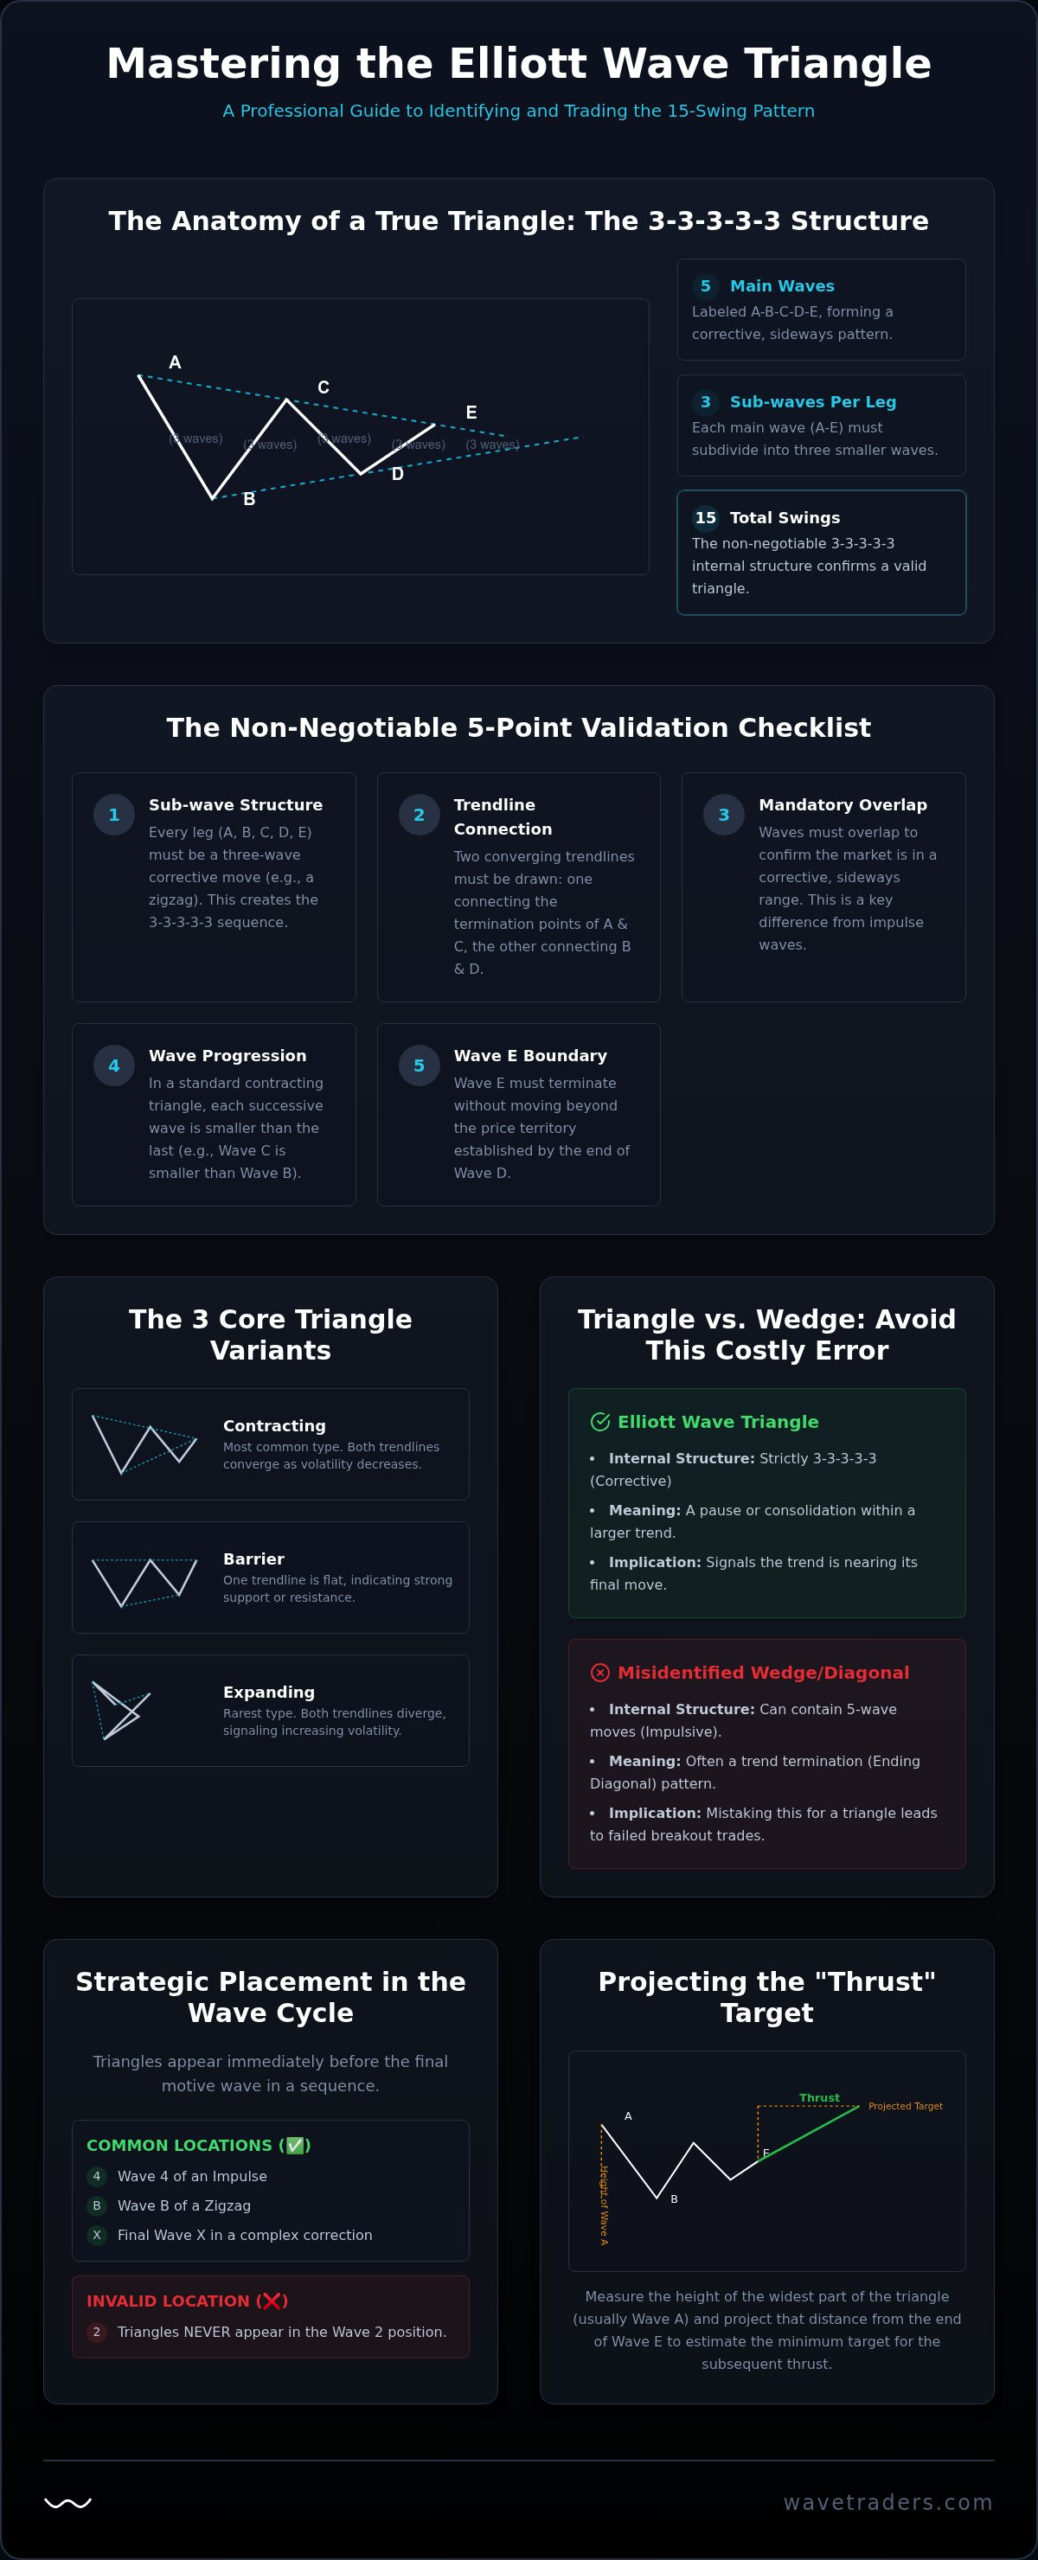
A triangle in the markets is far more than just two converging trendlines; it’s a sophisticated 15-swing internal structure that signals a specific stage of market exhaustion. If you’ve ever entered a trade on a breakout only to watch price reverse and stop you out, you likely fell victim to a common miscount. Mastering the Elliott Wave triangle rules is the difference between catching a terminal thrust and getting caught in a complex flat. It’s about looking past the general wedge shape to see the underlying 3-3-3-3-3 corrective pattern that defines a true Elliott Wave triangle.
We understand how frustrating it is to get the direction right but the timing wrong, especially when wave E overshoots your level or wave D lures you in too early. This guide provides the non-negotiable rules you need to validate these patterns in real-time. You’ll learn exactly where triangles occur in the larger cycle and how to use a specific checklist to increase your win rate on thrust trades. We’re going to move beyond basic theory and into the professional application you need to trade these setups with quiet confidence.
In market technicals, a triangle is a corrective pattern that reflects a temporary balance of power between buyers and sellers. While many traders see a simple sideways consolidation, an Elliott Wave practitioner sees a specific five-wave structure labeled A-B-C-D-E. This pattern represents a period where the market’s energy is being coiled, usually resulting in a significant move once the consolidation finishes. To correctly identify this setup, you must follow the Elliott Wave triangle rules, specifically the 15-swing internal structure.
The 15-swing rule is a non-negotiable requirement for validation. This means that every one of the five main waves (A through E) must subdivide into three smaller sub-waves. This creates a 3-3-3-3-3 internal count. If you see a five-wave motive sequence inside one of these legs, the pattern is likely something else entirely. This internal subdivision is what gives the triangle its corrective nature, as it lacks the impulsive strength to drive a new trend until the pattern is complete.
From a psychological perspective, triangles represent a period of decreasing volume and increasing tension. As price moves toward the apex of the triangle, the swings become smaller and more overlapping. This compression suggests that neither the bulls nor the bears can gain a definitive advantage. However, this lack of movement is deceptive. The exit from a triangle is usually fast and explosive, a phenomenon known as the “thrust.” This thrust is the market’s way of releasing the energy stored during the consolidation phase.
A common error among traders is confusing a standard price wedge with an Elliott Wave triangle. Traditional technical analysis often defines a wedge based solely on the outer trendlines. However, the Elliott Wave Principle requires a look at the internal components. An Elliott Wave triangle must consist of corrective sub-waves, typically zigzags or flats. If you identify a five-wave internal move within the structure, it disqualifies the pattern as a triangle and may instead be a leading or ending diagonal. Understanding this distinction prevents you from entering a trade based on a false breakout signal.
Triangles are unique because they almost always appear in the position immediately preceding the final motive wave of a larger sequence. You’ll typically find them in Wave 4 of an impulse, Wave B of a zigzag, or as the final Wave X in a complex correction. Because they signal that the current trend is nearing its conclusion, they’re excellent warning signs for traders looking to lock in profits. It’s important to remember that triangles never appear in the Wave 2 position. If you think you’ve found a triangle early in a new trend, it’s likely a different corrective structure, such as a flat.
Validation is the cornerstone of professional analysis. Without a strict adherence to Elliott Wave triangle rules, a trader is simply drawing lines on a chart and hoping for the best. To move from guesswork to a reliable trade setup, you must apply five core rules to every potential triangle you identify. These rules act as a filter, helping you discard the “look-alike” patterns that often lead to costly fakeouts in sideways markets.
The first and most critical rule is the sub-wave subdivision. Every leg of the triangle must be a three-wave corrective move, creating a 3-3-3-3-3 sequence. These are usually zigzags, though sometimes one leg may develop into a more complex flat. Second, the pattern is defined by two specific trendlines: one connecting the termination points of waves A and C, and another connecting waves B and D. Third, these waves must overlap. Unlike an impulse wave where overlap is a violation, a triangle requires it to prove the market is in a corrective range. Fourth, in a standard contracting triangle, each successive wave must be smaller than the previous one; Wave B is smaller than A, C is smaller than B, and so on. Finally, Wave E must never move beyond the price territory of Wave D. This boundary is what maintains the coiled energy of the pattern.
Drawing your trendlines correctly is the first step toward accurate validation. You should always connect the termination points of the waves, not the extreme price spikes that might occur mid-leg. In modern, high-volatility markets, we often see “throw-overs” where Wave E briefly pierces the A-C trendline before the final thrust begins. These minor breaches don’t necessarily invalidate the count as long as the internal 3-swing structure remains intact and the price doesn’t exceed the start of Wave D. You can see how these line breaches look in practice by reviewing these Elliott Wave forex trading examples, which highlight real-world price action and trendline management.
While the Elliott Wave triangle rules define the structure, Fibonacci ratios provide the internal proportions that signal a trade is ready. Most often, successive waves relate to one another by a factor of 0.618. For instance, Wave C typically reaches approximately 61.8% of the length of Wave A. When the market is particularly deep in its correction, Wave E might retrace 78.6% of Wave D. This 0.786 level often serves as a high-probability entry signal for traders looking to catch the ensuing thrust. If you find yourself struggling to visualize these overlapping swings on a live chart, the Elliott Wave School provides step by step guidance for identifying these patterns in real time. Understanding these ratios helps you anticipate where Wave E will likely terminate, giving you a tighter stop-loss and a better risk-to-reward ratio.
While the 3-3-3-3-3 internal structure remains constant, the external appearance of a triangle changes depending on the balance of market forces. Most traders are familiar with the contracting triangle, where price action converges toward an apex as volatility diminishes. However, the Elliott Wave triangle rules also account for variations that reflect higher momentum or specific resistance levels. Recognizing these variants is essential for understanding the likely direction and strength of the subsequent breakout.
Expanding triangles, often called “megaphones,” are the opposite of the contracting variety. In these patterns, volatility increases as the pattern progresses, with each successive wave becoming larger than the last. These are rarer and often reflect a market in a state of high uncertainty or emotional extremes. Regardless of the shape, the internal subdivision must still adhere to the corrective rules discussed earlier. Whether contracting or expanding, the pattern serves the same purpose: a final consolidation before the trend resumes.
The barrier triangle is a specific variation where one of the trendlines is essentially horizontal. This usually occurs because the market is testing a significant level of support or resistance that it isn’t yet ready to break. A key identifying feature is that the horizontal line almost always appears on the side of the eventual breakout. If the upper trendline (connecting B and D) is flat, it suggests a bullish breakout is building as sellers fail to push price lower while buyers maintain a steady ceiling.
It’s easy to confuse a barrier triangle with a flat correction, but the internal count provides the answer. A flat has a 3-3-5 structure, while a barrier triangle must maintain the 3-3-3-3-3 subdivision. You can see how these patterns play out in our recent EUR/USD Elliott Wave analysis, where horizontal resistance often forms the basis for these setups in the FX markets. The horizontal line acts as a clear invalidation level for your trade setup.
A running triangle is perhaps the most deceptive variant. In this scenario, Wave B actually ends beyond the starting point of Wave A. This occurs when the underlying trend is so strong that the market cannot even manage a standard retracement. It signals immense momentum in the direction of the larger trend. Because the market is so eager to move, the correction “runs” in the direction of the main trend before the final Wave E completes.
Traders often make the mistake of labeling a running triangle as a failed impulse or a new trend starting too early. To verify this pattern under the Elliott Wave triangle rules, you must ensure that Wave C still retraces a significant portion of Wave B. If price action continues without that corrective overlap, your count is likely wrong. This variant serves as a reminder that triangles don’t always look like perfect symmetry; they are reflections of the tug-of-war between trend momentum and corrective exhaustion.
Sideways markets are often the most difficult environments for traders to navigate, largely because they invite a wide range of subjective interpretations. One of the biggest myths in technical analysis is the assumption that any sideways consolidation is a triangle. In reality, many of these periods are actually complex “W-X-Y” flats or combinations. To differentiate between these patterns, you must strictly apply the Elliott Wave triangle rules regarding internal subdivision. If you identify five sub-waves within Wave C, for instance, you’ve already invalidated the triangle count. A true triangle requires every leg to be a corrective three, never an impulsive five.
Another frequent mistake is falling for the “premature thrust” trap. This happens when a trader assumes Wave D is the final move of the correction and enters a position before the pattern is finished. Because triangles are five-wave structures (A-B-C-D-E), entering at the end of Wave D leaves you exposed to the final retracement of Wave E. This final leg is often a slow, grinding move that can hit your stop-loss before the real breakout even begins. Additionally, you should pay close attention to the apex of the pattern. Most valid triangles resolve between 60% and 80% of the way to the apex. If price action continues until the trendlines actually meet, the pattern has likely morphed into a different corrective structure.
Differentiating a simple triangle from a complex triple three correction requires a look at both time and volume. Complex corrections often drag on significantly longer than a standard triangle would suggest. Volume profile is a particularly useful tool here; in a triangle, volume typically diminishes steadily as price approaches the apex. If volume remains high or erratic throughout the consolidation, it’s a signal that the market is likely forming a complex flat or a combination rather than a triangle. If your triangle count lasts too long and price moves past the expected apex time, you should immediately re-label the structure as a double or triple three to reflect the increased complexity.
In high-volatility environments, Wave E frequently breaches the A-C trendline in what we call an overshoot. Many retail traders see this breach as a signal that the pattern has failed and close their positions, only to watch the market thrust in the intended direction moments later. Professional practitioners often set their stop-losses based on the extreme of Wave C rather than the trendline itself to account for this volatility. This approach allows for the final “shakeout” to occur without prematurely ending the trade. To help you navigate these high-stakes turning points without getting trapped, you can learn to identify market traps using our professional counting methodology. This training ensures you can distinguish between a genuine trendline violation and a standard Wave E overshoot that precedes a terminal thrust.
The completion of Wave E marks the moment of maximum tension before the market releases its energy in a terminal move. This move, known as the “thrust,” is the primary reason traders study Elliott Wave triangle rules. By the time price reaches the end of the consolidation, the risk-to-reward ratio is often at its most favorable point. To trade this effectively, you must understand both the price target and the time-based expectations for the breakout.
Calculating the target for a triangle thrust is relatively straightforward. You measure the vertical distance of the widest part of the triangle, which is typically the height of Wave A. You then project this distance from the termination point of Wave E. This gives you a minimum price objective for the ensuing move. While price can exceed this target, it serves as a reliable zone to begin looking for signs of trend exhaustion. Timing is equally important; the apex where the trendlines meet often acts as a time-based target for the completion of the thrust sequence.
Confirmation signals on lower timeframes help ensure you aren’t catching a false break. Look for a small five-wave impulsive sequence to start the thrust move. If you see RSI divergence at the end of Wave E, it adds further weight to the idea that the correction has finished. For risk management, placing a stop-loss at the extreme of Wave C provides a safe buffer against the common overshoots discussed earlier. As the thrust progresses, you can trail your stop behind the sub-waves of the final motive sequence to lock in profits.
While the height of Wave A provides a base target, professional analysts use Fibonacci extensions to find cluster zones. Our proprietary Elliott Wave Calculator allows you to input the coordinates of the triangle legs to find where multiple Fibonacci levels align. These clusters often provide more precise targets than a simple measurement. It’s also helpful to compare these triangle-specific objectives with the larger goals for Wave 3 or Wave 5 in the higher-degree cycle. When a triangle thrust target aligns with a major Fibonacci extension of the larger trend, the probability of a successful trade increases significantly.
Identifying a triangle in real-time is a skill that requires practice and a deep understanding of market structure. While hindsight makes every pattern look clear, live markets are often messy and require a disciplined approach to label correctly. Our team provides real-time analysis across FX and digital currencies, helping you see these patterns as they develop rather than after the thrust has already occurred. If you want to move beyond the basics, Apply for a Wavetraders Membership to access live Elliott Wave charts and analysis. Joining the Elliott Wave School will also introduce you to advanced concepts and variations that help you stay ahead of the curve.
Correctly identifying a triangle is one of the most rewarding skills an analyst can develop. It provides a clear roadmap for the final stage of a correction and sets the stage for a high-probability breakout. By adhering to the strict Elliott Wave triangle rules, you move beyond subjective guessing and begin to see the market’s internal rhythm. You now understand that every leg must be a corrective three and that the Wave E overshoot is often a signal of intent rather than a reason to abandon your count.
The journey from basic theory to professional execution requires consistent practice and access to the right tools. At Wavetraders, we provide the resources you need to refine your counts, including expert video lessons in our Elliott Wave School and real-time analysis across FX, Crypto, and Commodities. You can also utilize our proprietary trading tools and calculators to project precise thrust targets with confidence. Master the markets with professional Elliott Wave analysis; Join Wavetraders today. We look forward to tracking these complex patterns together as you grow your expertise.
No, a triangle cannot appear in the Wave 2 position. According to the Elliott Wave triangle rules, these patterns only occur in positions prior to the final motive wave of a sequence. This includes Wave 4 of an impulse, Wave B of a zigzag, or the final Wave X in a complex correction. If you think you’ve found a triangle in Wave 2, it’s likely a different corrective structure or a miscount of the larger trend.
A contracting triangle features two converging trendlines where volatility diminishes toward an apex. In contrast, a barrier triangle has one essentially horizontal trendline, usually the B-D line in a bullish market or the A-C line in a bearish one. This horizontal barrier signals a specific level of resistance or support that the market is testing. Both variants must still maintain the internal 3-3-3-3-3 subdivision to be valid.
You calculate the target by measuring the height of the widest part of the pattern, which is typically Wave A. Project this distance from the termination point of Wave E in the direction of the breakout. For greater precision, professional traders often use tools like the Elliott Wave Calculator to find Fibonacci cluster zones. These clusters help identify where the thrust is likely to exhaust itself within the larger market cycle.
Not necessarily, though zigzags are the most common sub-waves found in these patterns. The rules simply require that each of the five waves (A-E) be a corrective three-wave structure. This can include zigzags, double zigzags, or even complex flats. The non-negotiable requirement is that they must be corrective 3s and never five-wave impulsive sequences. If one leg is a clear impulse, the triangle count is invalidated.
If price action continues until the trendlines actually meet or pass the apex, the triangle count is likely invalid. Most triangles resolve between 60% and 80% of the distance to the apex. A move that lingers too long usually indicates that the market has morphed into a more complex double or triple three correction. In these cases, the coiled energy required for a terminal thrust has dissipated into a longer sideways grind.
This internal structure is the only reliable way to differentiate a true triangle from a simple wedge or a diagonal. Standard technical analysis doesn’t account for internal swings, but Elliott Wave requires 15 total swings. Without this 3-3-3-3-3 subdivision, you cannot confirm the market is in the specific corrective state required for a thrust. Following these Elliott Wave triangle rules prevents you from entering early on impulsive moves that look like breakouts.
Yes, an expanding triangle can appear in the Wave 4 position, though it’s much rarer than the contracting variety. These patterns reflect increasing volatility and market uncertainty, appearing as a megaphone shape on the chart. If you identify an expanding structure in Wave 4, you should expect the subsequent Wave 5 to be a terminal move. This is often followed by a sharp reversal as the larger degree trend reaches its final exhaustion point.
You handle a running triangle by acknowledging that Wave B has ended beyond the start of Wave A due to powerful underlying momentum. In this scenario, the correction runs in the direction of the main trend. To validate this count, you must ensure that Wave C still retraces a significant portion of Wave B. The internal structure must still adhere to the 3-3-3-3-3 rules despite the price extremes caused by the trend’s strength.
DISCLAIMER
Any reviews, news, analysis, prices or other information contained on our website is provided as general market commentary and delivered electronically through a distribution channel to larger number of clients, therefore does not constitute investment advice or investment research. We are not trading advisors. Most of our work is for educational purposes only, with information based on Elliott Wave theory in real time. Trading forex, futures, options, stocks, cryptocurrenices or any another trading market carries a high level of risk, and may not be suitable for all investors.
The possibility exists that you could lose some or all of your initial investment; therefore you should not invest money that you cannot afford to lose. Our website and the information that we provide should not be relied upon as a substitute for extensive independent research before making your investment decisions. In no event will we be liable for any loss or damage on your account in connection with, the use of our products. For any real cash investments you have to contact your financial advisor.
Any information or material contained on our website is owned by Val Global d.o.o.. Reproduction is prohibited without Val Global d.o.o. prior license in writing.
By continuing to use the site, you agree to the use of cookies. Learn more.
The cookie settings on this website are set to "allow cookies" to give you the best browsing experience possible. If you continue to use this website without changing your cookie settings or you click "Accept" below then you are consenting to this.