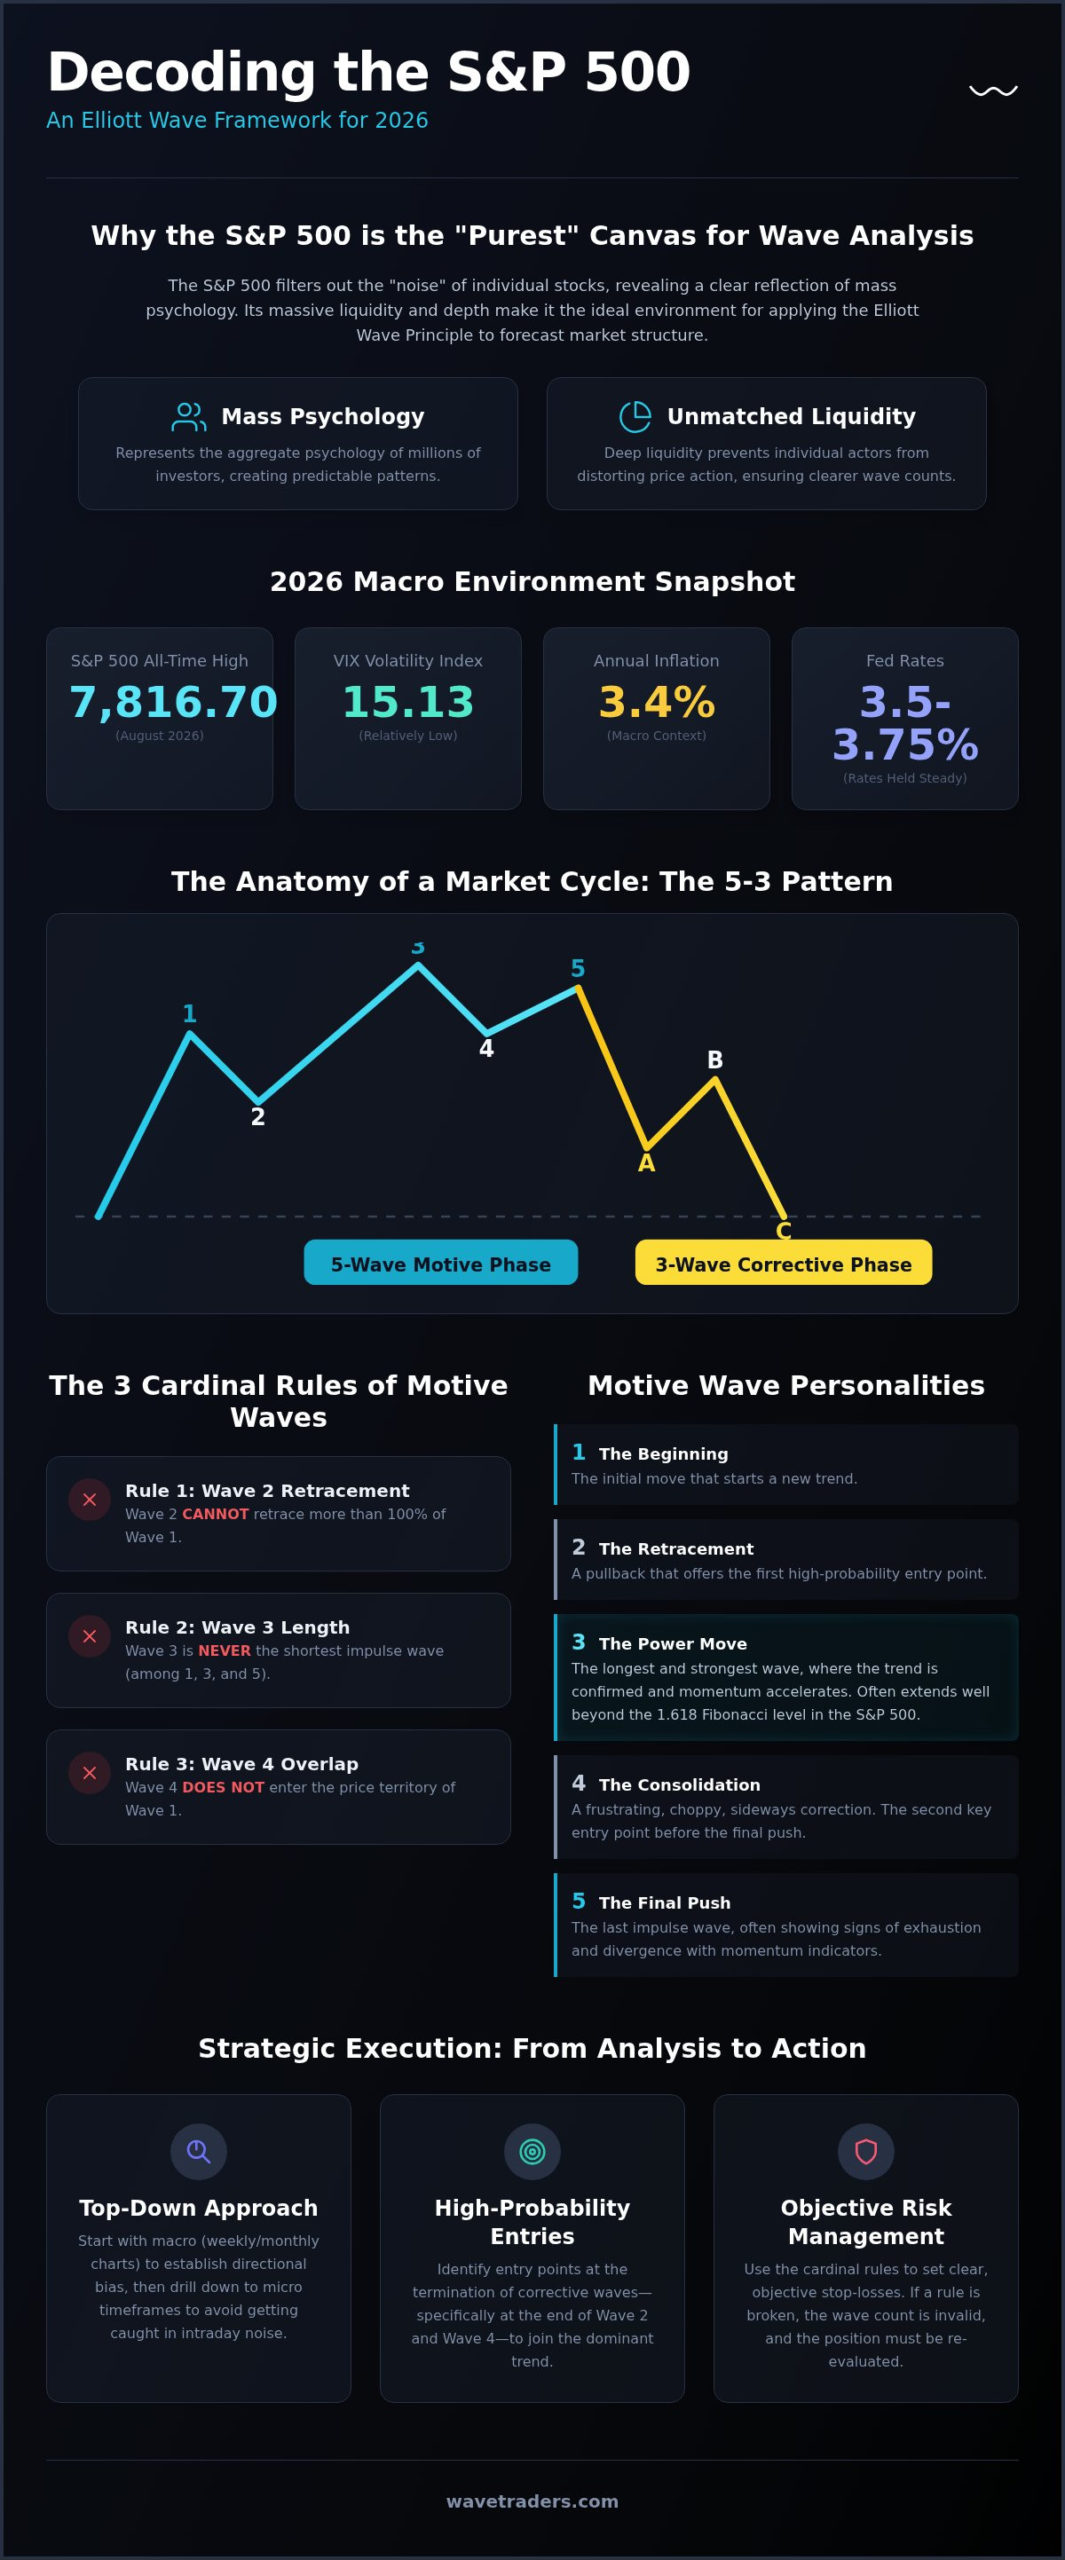
The S&P 500 is the ultimate reflection of mass psychology, making it the most “pure” environment for Elliott Wave analysis if you understand its tendency for extended third waves. With the index reaching an all-time high of 7,816.70 in August 2026, many traders feel the mounting pressure of “noise” in intraday charts. It’s often difficult to tell if a 1.6% dip from a record close is a minor pause or the start of a deep correction. Using a consistent S&P 500 Elliott Wave framework allows you to filter out the market’s constant chatter and focus on the structural patterns that actually drive price action.
You’ve likely felt the frustration of watching lagging indicators miss the explosive start of a wave 3 or struggled to distinguish a trend reversal from a simple pullback. We understand that navigating volatile swings requires more than just a guess; it requires a methodical roadmap. In this guide, you’ll discover how to apply Elliott Wave Theory to the S&P 500 with professional precision to identify high-probability trends. We’ll provide a clear outlook for the 2026 market cycle, specific rules for identifying entry points, and the confidence to manage risk even as the VIX sits at a low of 15.13. Let’s look at how these patterns are currently unfolding.
The S&P 500 serves as the primary benchmark for global investor sentiment, acting as a massive pool where the capital of millions of participants converges. Because it tracks the 500 largest U.S. companies, it offers a level of liquidity that few other instruments can match. This depth is critical because technical analysis often fails in less liquid markets where individual actors can distort price action. By contrast, the S&P 500 Elliott Wave structure remains remarkably clear because it represents the aggregate psychology of the crowd. While traditional indicators like moving averages or RSI can signal that a trend is overextended, they lack the ability to define the structural maturity of a move. The Elliott Wave Principle succeeds here by providing a map that identifies whether the index is in a terminal wave 5 or just beginning an explosive wave 3.
The law of large numbers suggests that collective behavior becomes more predictable as the number of participants increases. Individual stocks are vulnerable to idiosyncratic risks, such as unexpected earnings misses or management changes, which can create gaps and “broken” wave counts. The S&P 500 filters out this noise, leaving a clean reflection of social mood and economic expectations. This index has a distinct personality defined by high momentum and a tendency for extended bull market runs. As we observe the market in 2026, the rally toward the all-time high of 7,816.70 demonstrates this persistence. Traders who understand this personality can avoid the mistake of calling for a top too early during a powerful motive sequence.
Success in forecasting requires a top-down approach that starts with the macro cycle. By defining the primary trend on weekly or monthly charts, you establish a directional bias that prevents you from getting chopped up by minor pullbacks. Many retail traders fail because they over-analyze 1-minute charts, reacting to intraday noise without realizing they’re trading against a massive wave 3 impulse. In the current 2026 environment, with annual inflation at 3.4% and the Fed holding rates steady between 3.50% and 3.75%, the macro context provides the “why” behind the wave structure. You don’t need to catch every tick to be profitable; you just need to be on the right side of the dominant degree. The fractal nature of S&P 500 waves means that the same self-similar patterns repeating on a five-minute chart are the identical structures that form the multi-year bull market cycles.
The five-wave motive structure is the engine of the S&P 500 bull market. It represents a clear, directional advance driven by collective optimism. When we conduct an S&P 500 Elliott Wave analysis, our first goal is to identify these impulsive sequences. Every valid motive wave must follow a few strict rules. Wave 2 can’t retrace more than 100% of Wave 1. Wave 3 is never the shortest among waves 1, 3, and 5. Wave 4 cannot enter the price territory of Wave 1. If any of these rules are broken, the count is wrong, and we have to re-evaluate our position. It’s that simple.
Wave 3 is where the most significant gains occur. In major indices, this wave is almost always the longest. It represents the “point of recognition” where the broader market finally accepts the new trend. Following this surge, Wave 4 typically appears as a profit-taking zone. It’s often a frustrating, choppy period where the index moves sideways rather than crashing. This sideways action allows the market to digest gains before the final push in Wave 5.
Third waves in the S&P 500 often extend well beyond the common 1.618 Fibonacci extension. Because of the index’s deep liquidity, momentum tends to feed on itself. To confirm you’re in a true Wave 3 breakout, look at volume and momentum indicators. Price should be making new highs while the VIX remains relatively low, such as the 15.13 level seen on August 21, 2026. If momentum is accelerating alongside price, you’re likely in the heart of a third wave. If you’re still struggling to label these structures accurately, our Elliott Wave School offers a structured path to help you stop guessing and start trading with clarity.
As the S&P 500 Elliott Wave count progresses toward a cycle peak, like the August 2026 high of 7,816.70, Wave 5 provides the final blow-off top. This is a dangerous time for traders who don’t recognize the signs of exhaustion. Look for bearish divergence on your oscillators. This happens when the index makes a higher high in price but a lower high in momentum. It suggests the buying pressure is drying up. You should also be aware of the “Truncated Fifth” wave. This rare phenomenon occurs when Wave 5 fails to move past the peak of Wave 3. It’s a massive warning sign that a deep correction is imminent. Transitioning your mindset from motive to corrective thinking at this stage is vital for protecting your capital.
Corrections represent the greatest source of frustration for many traders. In a trending market, the direction feels clear, but corrective phases introduce ambiguity and choppy price action. Using a disciplined S&P 500 Elliott Wave approach helps you stay patient when the index stops making straightforward gains. One of our most reliable tools during these times is the Alternation Rule. It suggests that if Wave 2 was a sharp, deep retracement, Wave 4 will likely be a complex sideways pattern. This simple guideline keeps you from expecting the same price behavior twice in a row. It saves you from premature entries.
Zigzags are aggressive counter-trend moves that often retrace deep into the previous motive wave. We typically look for the floor around the 0.5 or 0.618 Fibonacci retracement levels. When the S&P 500 pulls back from a significant peak, like the 7,816.70 high reached in August 2026, identifying the corrective structure early allows you to look for support rather than reacting with panic. Zigzags are fast. They’re designed to shake out weak hands quickly before the primary trend resumes.
Sideways moves often take the form of triangles. These follow a distinct 3-3-3-3-3 structure, where each of the five sub-waves consists of three smaller waves. Applying Elliott Wave triangle rules is essential for identifying these patterns before the “thrust” occurs. In the S&P 500, triangles usually appear in the Wave 4 position. This means they typically precede the final wave of a sequence. They provide a clear signal that the primary trend is about to resume for one last push toward new highs.
Flats are another common consolidation pattern where the index moves in a range. The S&P 500 frequently forms “Expanded Flats,” which are notorious for trapping early sellers and buyers alike. In an expanded flat, the B-wave actually breaks above the start of the correction, creating a fake breakout that looks like the start of a new rally. This “B-wave trap” lures in momentum buyers right before the aggressive C-wave begins. We typically target the C-wave completion at the 1.236 or 1.618 Fibonacci extension of wave A. Recognizing these nuances prevents you from being caught on the wrong side of a market fake-out.
Analysis is a vital first step, but execution is what determines your bottom line. Successful practitioners don’t just guess where a move might end; they look for high-confluence zones where the S&P 500 Elliott Wave count aligns with specific price levels. The most lucrative opportunities typically emerge at the termination of Wave 2 and Wave 4. These areas represent the points of maximum reward versus risk, provided you have a clear plan for invalidation. Scaling into these positions allows you to build a larger stake as the market confirms your count, rather than risking everything on a single entry.
Objective stop-losses are the backbone of professional trading. Unlike traditional technical analysis which might place a stop at a random moving average, Elliott Wave provides specific “line in the sand” levels. For instance, if you’re trading a Wave 3 impulse, your stop-loss belongs at the start of Wave 1. If price hits that level, your count is objectively wrong. Integrating a disciplined Elliott Wave risk management strategy ensures that a single failed count doesn’t derail your entire year. It’s about protecting capital so you can stay in the game for the next high-probability setup.
The “Golden Zone” is a specific range between the 50% and 61.8% Fibonacci retracement levels. In the S&P 500, Wave 2 often finds its floor in this area before the explosive Wave 3 begins. We use the Fibonacci Elliott Wave trading approach to project these targets with high precision. When price reaches these levels at the same time our internal wave count completes its sub-waves, we have a high-probability entry signal. This time-price squaring reduces the “noise” that often leads to overtrading during volatile sessions.
The volatility of the S&P 500 in 2026 presents unique opportunities for prop traders. While the index can move hundreds of points in a week, strict drawdown rules require tight risk control. The S&P 500 Elliott Wave structure is particularly suited for this environment because it allows you to select high risk-reward setups. By focusing on “clean” wave counts, you can target the heart of a third wave. This offers the momentum needed to hit profit targets quickly without violating daily loss limits. If you’re ready to trade with more capital, you can explore our Funded Trader Program to put these strategies into practice with professional backing.
Developing a consistent edge in the markets isn’t just about learning a set of rules; it’s about the daily application of those rules under varying conditions. While understanding the S&P 500 Elliott Wave structure is a great start, the real challenge lies in maintaining objectivity when the index is moving fast. This is why we focus on a practitioner-teacher approach. We don’t just provide counts; we show you the logical chain behind every interpretation. By joining a community of like-minded traders, you can move away from the emotional noise of the crowd and focus on the methodical analysis that professional-grade trading requires. For financial professionals who need to maintain a clear overview of their clients’ total wealth alongside these market insights, you can visit PlanWise to see how their digital dashboard consolidates financial summaries.
The curriculum at our Elliott Wave School is designed to take you from the basic motive structures to the most complex corrective patterns. We believe that structured learning is the only way to escape the cycle of guessing that often plagues traders who rely on social media for their counts. You’ll learn how to identify high-probability setups and, more importantly, when to stay on the sidelines. While many of our students start with our FX Service, the principles of wave theory are universal. Transitioning your skills to major indices like the S&P 500 becomes a natural progression once you’ve mastered the core methodology. Access to video lessons and live chart examples ensures that you’re seeing the patterns unfold in real-time, not just in a textbook.
Our members receive daily updates that keep them aligned with the primary trend. In a year like 2026, where the index has seen a 12.1% year-to-date rise and a VIX low of 14.18 as of mid-August, staying grounded in structural analysis is vital. Our FX Service provides the macro context needed to understand the broader dollar environment, which often impacts equity indices. You’ll receive clear roadmaps that highlight potential turning points and invalidation levels. This level of detail helps you trade with quiet confidence rather than anxiety. It’s about following a considered opinion rather than a breathless alert service. Apply for a Wavetraders membership to access pro-grade S&P 500 analysis.
Mastering the market’s cycles requires more than just identifying a trend; it demands a deep understanding of the structural patterns that drive price action. We’ve explored how motive waves provide the engine for growth and how corrective structures like triangles and flats can trap the unprepared. By identifying objective invalidation levels and using Fibonacci confluence, you can move away from emotional reactions and toward a methodical, professional approach.
Since 2003, we’ve focused on sharing this practitioner-led expertise with our community. Whether you’re looking to refine your S&P 500 Elliott Wave counts through the Elliott Wave School or seeking to trade with more capital via our Funded Trader Program partnerships, the path to mastery is built on consistent, disciplined analysis. The 2026 market cycle will continue to present opportunities for those who can read the waves with clarity. We invite you to join Wavetraders today for expert S&P 500 analysis and professional education. Let’s track the next major move together.
Elliott Wave analysis is exceptionally effective for the S&P 500 because the index represents the aggregate psychology of millions of participants. This deep liquidity ensures that price action follows the law of large numbers, making patterns more reliable than in individual stocks. By using an S&P 500 Elliott Wave framework, you can identify high-probability turning points that traditional indicators often miss. It’s particularly useful for distinguishing between a temporary pullback and a full trend reversal.
The most frequent pattern is the five-wave motive structure, specifically one featuring an extended third wave. In equity indices, the third wave is typically the longest and strongest part of the sequence, reflecting the point of recognition where the majority of investors enter the trend. You’ll also frequently encounter complex sideways corrections in the Wave 4 position, such as triangles or flats, which allow the index to digest gains before the final Wave 5 push.
A true Wave 3 breakout is identified by a sharp increase in momentum and price acceleration. In the S&P 500, this often manifests as a series of gap-ups or a breakout above the peak of Wave 1 with expanding volume. You should see oscillators like the RSI stay in overbought territory for extended periods without showing divergence. This reflects the intense buying pressure that characterizes the heart of a motive sequence in major stock indices.
Elliott Wave is highly versatile and applies to all timeframes due to its fractal nature. Intraday traders can use the same five-wave and three-wave structures on 5-minute or 15-minute charts to find precise entry points. However, it’s vital to align your intraday count with the larger macro cycle. Trading a 1-minute impulse against a 4-hour corrective wave often leads to frustration. Always establish the primary trend on higher degrees before zooming in for execution.
Invalidation is a critical part of the process and occurs when price violates a core rule, such as Wave 4 entering Wave 1 territory. When this happens, you must immediately close the position or adjust your stop-loss and switch to your alternate count. Invalidation isn’t a failure; it’s an objective signal that the market is following a different path. This clarity is what allows practitioners to manage risk effectively during volatile index swings.
Fibonacci levels provide the mathematical basis for price targets and retracement zones within your S&P 500 Elliott Wave analysis. We typically look for Wave 2 to retrace 50% to 61.8% of Wave 1, while Wave 3 targets are often set at 1.618 or 2.618 extensions of the first wave. These ratios help you identify high-confluence areas where multiple wave degrees terminate at the same price level, increasing the probability of a successful trade. For a deeper dive into applying these ratios with precision, our guide on Fibonacci Elliott Wave trading covers the specific techniques used by professional analysts.
As of August 21, 2026, the S&P 500 is in a strong daily uptrend, having recently reached an all-time high of 7,816.70. While some analysts suggest we’re in the final stages of a motive wave targeting the 8,000 level, others are watching for signs of a major correction since the index is 1.6% below its record close. Low volatility, with the VIX at 15.13, suggests the primary motive trend remains intact for now.
The best way to learn the methodology is through a structured curriculum like the Elliott Wave School. Learning from practitioners who have traded through multiple market cycles is far more effective than trying to piece together conflicting information from social media. Our program covers everything from basic rules to advanced pattern recognition, with a specific focus on high-liquidity instruments like the S&P 500. This ensures you develop the skills to count waves with professional precision.
DISCLAIMER
Any reviews, news, analysis, prices or other information contained on our website is provided as general market commentary and delivered electronically through a distribution channel to larger number of clients, therefore does not constitute investment advice or investment research. We are not trading advisors. Most of our work is for educational purposes only, with information based on Elliott Wave theory in real time. Trading forex, futures, options, stocks, cryptocurrenices or any another trading market carries a high level of risk, and may not be suitable for all investors.
The possibility exists that you could lose some or all of your initial investment; therefore you should not invest money that you cannot afford to lose. Our website and the information that we provide should not be relied upon as a substitute for extensive independent research before making your investment decisions. In no event will we be liable for any loss or damage on your account in connection with, the use of our products. For any real cash investments you have to contact your financial advisor.
Any information or material contained on our website is owned by Val Global d.o.o.. Reproduction is prohibited without Val Global d.o.o. prior license in writing.
By continuing to use the site, you agree to the use of cookies. Learn more.
The cookie settings on this website are set to "allow cookies" to give you the best browsing experience possible. If you continue to use this website without changing your cookie settings or you click "Accept" below then you are consenting to this.