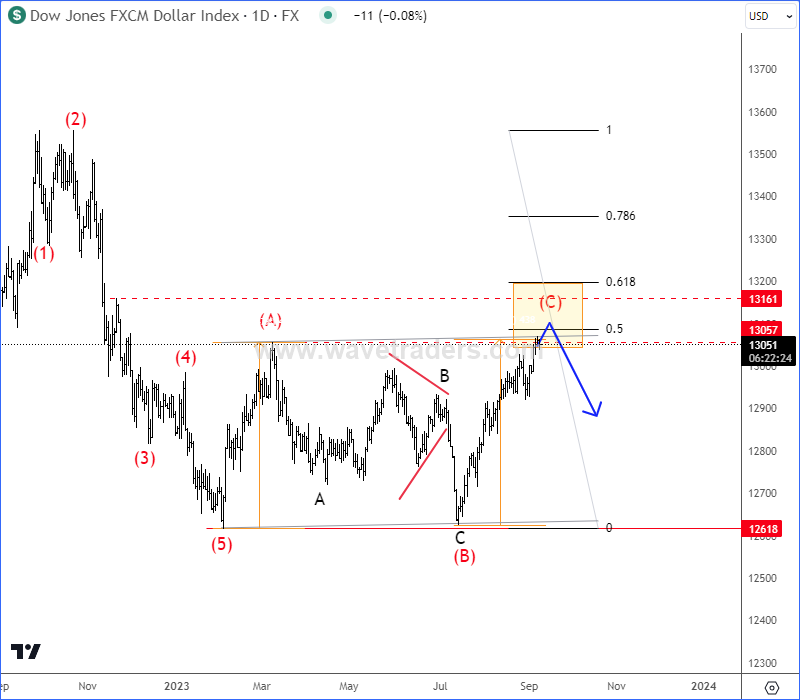
USDOLLAR – The Dollar Index Dow Jones chart from FXCM is a basket chart, which was developed by traders for traders allowing you to take advantage of US Dollar appreciation or depreciation with precise tracking and maximum liquidity. The index basket is designed to be as easy to understand as it is to trade. It reflects the change in value of the US dollar measured against a basket of the most liquid currencies in the world: AUSSIE Dollar, EURO, British POUND and Japanese YEN.
From Elliott wave perspective USDOLLAR chart is trading at resistance zone for wave (C) of an (A)-(B)-(C) flat correction. So, ahead of important US CPI inflation report next week, be aware of limited rise and watch out, as bears may show up again at the end of 2023.

Become a premium member
Get daily Elliott Wave updates for US Single Stocks, SP500,DAX, GOLD, SILVER, CRUDE, FX, CRYPTO, etc. or apply for unlimited access to the Elliot Wave educational videos.
Dash Is Looking For The Final Leg Down. Check our blog HERE.