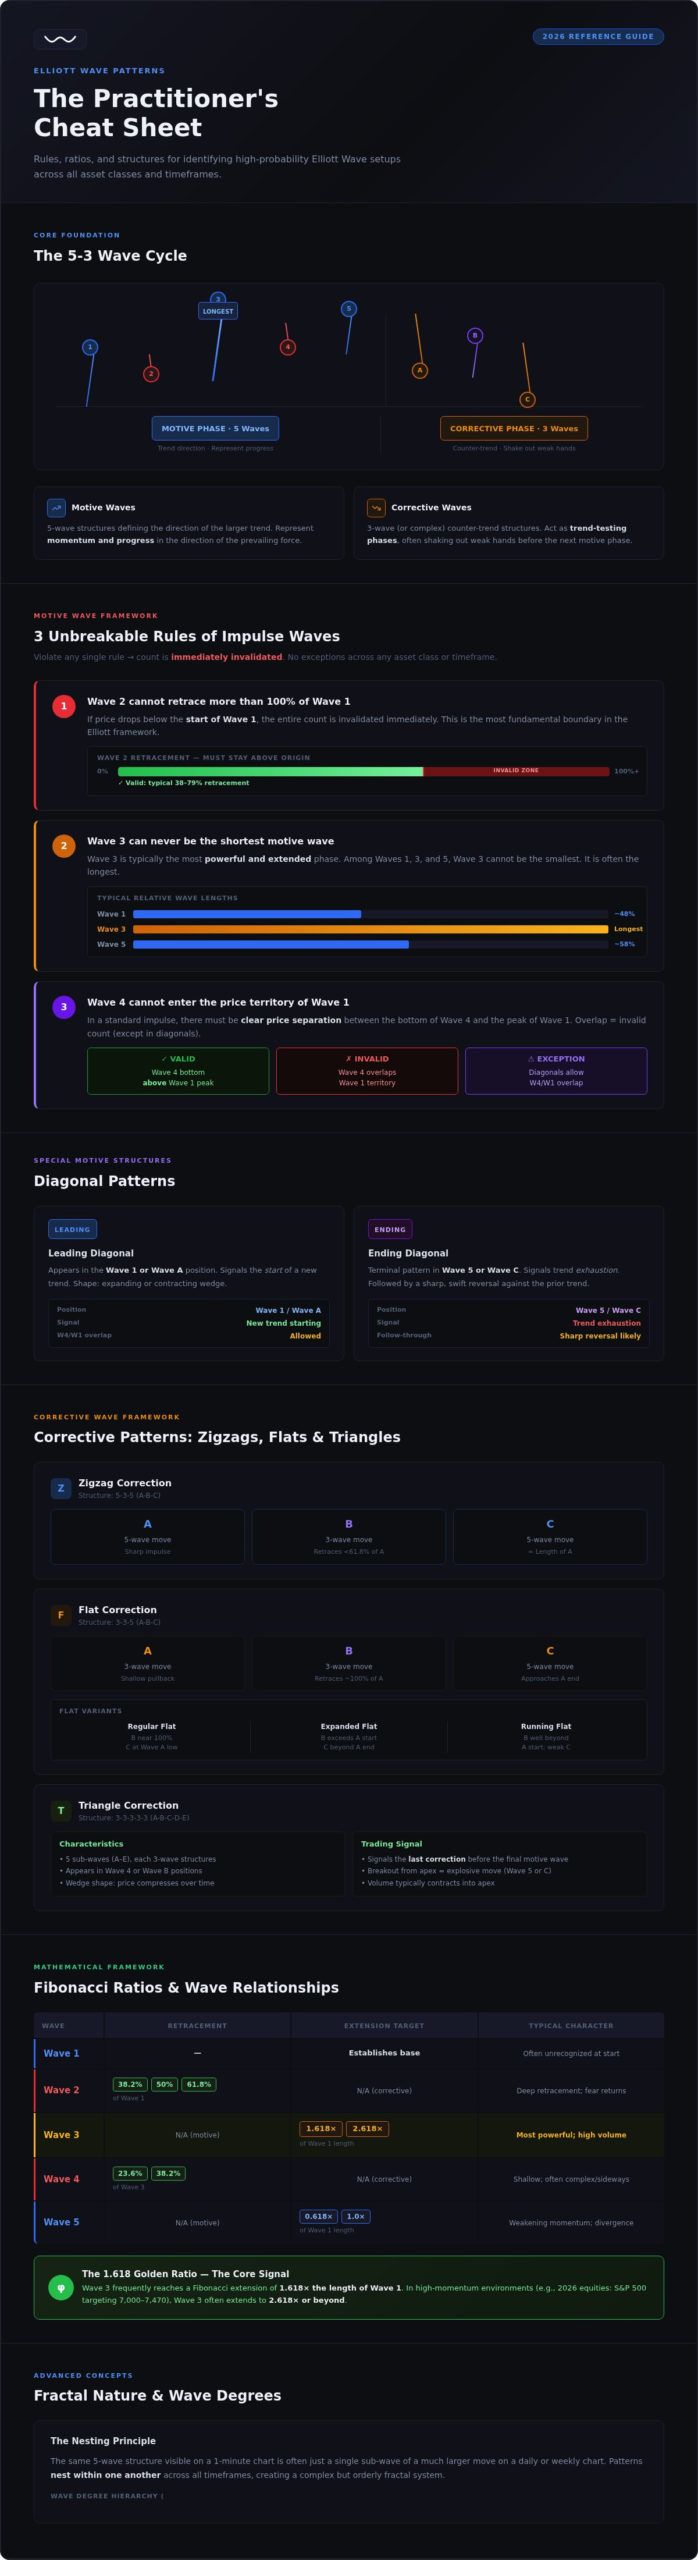
Why does a perfectly labeled impulse wave often fall apart the moment you commit capital to a trade? It’s usually because the line between a motive move and a complex correction becomes blurred when volatility spikes. This Elliott Wave patterns cheat sheet serves as your definitive 2026 reference to eliminate that confusion. We know how it feels to second-guess a count while the S&P 500 approaches its 7,400 target or Bitcoin enters a deep consolidation phase. You need a set of rules that don’t bend, no matter how fast the ticker is moving.
We’ve designed this guide to help you master the core structures and Fibonacci relationships that define high-probability setups. You’ll gain a clearer understanding of how to distinguish between different flat corrections and when to trust an impulse count. By the end of this practitioner-focused manual, you’ll have a reliable framework to validate your analysis and improve your entry timing. We’ll walk through the essential patterns, from basic zigzags to advanced diagonals, ensuring you’re equipped for the 2026 market environment.
Market movements aren’t just random price fluctuations. They represent the collective psychology of participants, oscillating between optimism and pessimism. This rhythmic ebb and flow creates the 5-3 wave cycle, which we consider the heartbeat of all financial markets. When you look at an Elliott Wave patterns cheat sheet, you aren’t just looking at geometry; you’re observing the predictable ways human crowds react to financial risk and reward. A practitioner’s mindset requires you to stop looking for certainty and start looking for these repeating psychological signatures.
Every market move consists of two primary components. Motive waves are the 5-wave structures that define the direction of the larger trend. They represent progress and momentum. In contrast, corrective waves are 3-wave structures, or more complex combinations, that move against that primary trend. These corrections act as trend-testing phases, often shaking out weak hands before the next motive phase begins. A wave degree refers to the relative size and duration of a specific pattern within the broader market hierarchy, allowing us to categorize waves from sub-minuette to grand supercycle.
Many traders rely heavily on lagging indicators like RSI, MACD, or moving averages. While these tools have their place, they only reflect what has already happened in the past. Wave patterns, rooted in the Elliott Wave principle, function as leading indicators. They provide a roadmap for future price action based on established, repeating structures. Instead of reacting to a crossover that happened several bars ago, you’re identifying a pattern that suggests where the market is likely to go next.
The theory is built on a fractal nature. This means the same 5-wave structure you see on a 1-minute chart is often just a small sub-wave of a much larger move on a daily or weekly chart. Patterns nest within one another across all timeframes, creating a complex but orderly system. This nesting is why an Elliott Wave patterns cheat sheet is so valuable; it helps you keep track of your location within multiple layers of market cycles. Understanding how a minor correction on a 15-minute chart fits into a major impulse wave on a 4-hour chart is what separates a novice from an experienced analyst.
Identifying a motive wave is the first step in establishing a directional bias. These structures represent the powerful, trending moves that most traders want to capture. However, a move is only a valid impulse if it adheres to specific structural requirements. If any of the following rules are violated, your count is incorrect, and you must re-evaluate the pattern. This section of our Elliott Wave patterns cheat sheet focuses on the rigid framework that governs these five-wave advances.
To maintain analytical integrity, you have to treat these rules as absolute. They don’t change based on the asset class or the timeframe you’re trading.
Wave 3 is typically the most powerful phase of the cycle. In many markets, Wave 3 frequently reaches a Fibonacci extension of 1.618 times the length of Wave 1. In high-momentum environments, such as the 2026 equity markets where the S&P 500 has targeted levels between 7,000 and 7,470, we often see Wave 3 extend even further. If you find yourself struggling to calculate these levels manually during a live session, using an Elliott Wave calculator can help you quickly identify high-probability reversal zones.
Diagonals represent a unique exception where Wave 4 and Wave 1 overlap. These patterns usually take the shape of a wedge. A Leading Diagonal appears in the Wave 1 or Wave A position, signaling the start of a new trend. Conversely, an Ending Diagonal serves as a terminal pattern in the Wave 5 or Wave C position, indicating that the current trend is exhausted and a sharp reversal is likely.
Internal structures in diagonals differ from standard impulses. Instead of the typical 5-3-5-3-5 sub-wave count, many diagonal variations exhibit a 3-3-3-3-3 structure. This means every leg of the wedge is composed of three waves rather than five. Recognizing this subtle shift in internal rhythm is crucial for distinguishing a terminal wedge from a standard motive move. It’s this level of detail that allows you to anticipate the sharp “throw-over” often seen at the end of a trend before a significant correction begins.
If motive waves represent the market’s progress, corrective patterns represent its digestion. These structures are often where traders experience the most frustration because they’re inherently more complex and time-consuming than impulse waves. A reliable Elliott Wave patterns cheat sheet must prioritize these structures, as they’re the key to identifying where a trend will resume. We categorize corrections into three primary families: zigzags, flats, and triangles. Each has a distinct internal rhythm that signals how much “work” the market needs to do before it’s ready to move again.
The zigzag is the most aggressive corrective pattern. It follows a 5-3-5 internal structure, meaning Wave A and Wave C are both five-wave motive moves. Because of this, beginners often mistake Wave A for the start of a new trend. However, the three-wave B-wave confirms it’s merely a sharp retracement. Zigzags typically push deep into the territory of the previous impulse, often reaching the 50% or 61.8% Fibonacci levels.
Flat corrections move sideways rather than sharply against the trend. They follow a 3-3-5 internal structure, which indicates a lack of conviction from the counter-trend players. We look for three main variations based on the price action of Waves B and C.
Triangles represent a balance of forces, resulting in a period of sideways consolidation. They consist of five sub-waves (A-B-C-D-E), and each sub-wave has a 3-3-3-3-3 internal structure. We typically see four varieties: ascending, descending, contracting, and expanding. Triangles almost always appear in the “penultimate” position of a larger sequence. This means they’re usually found in Wave 4 of an impulse or Wave B of a correction.
The strategic value of a triangle lies in the “thrust” that follows the completion of Wave E. This thrust is a final, rapid move in the direction of the primary trend. You can often estimate the profit target for this move by measuring the widest part of the triangle and projecting that distance from the breakout point. When the market refuses to trend and produces overlapping moves that don’t fit these clean categories, we label them as complex corrections (WXY). These represent a combination of two or more simple corrective patterns joined by a “connector” wave, often seen in range-bound forex markets.
Geometry provides the structure, but Fibonacci ratios provide the measurements that make an Elliott Wave patterns cheat sheet actionable. While the mathematical relationships are precise, they’re driven by the shifting emotions of market participants. Understanding the “personality” of each wave helps you anticipate which Fibonacci level is most likely to act as a pivot point. Wave 3, for instance, is the engine of the trend. It’s typically the strongest and most recognizable phase, characterized by high volume and broad market participation. In this stage, doubt has vanished, and the crowd is fully committed to the new direction.
We use retracements to find entries and extensions to set profit targets. These levels aren’t guaranteed, but they represent areas of high mathematical probability where the market typically finds support or resistance.
The Rule of Alternation is a powerful guideline that helps you predict the complexity and depth of Wave 4 based on what happened in Wave 2. If Wave 2 was a sharp, deep correction like a zigzag, you should expect Wave 4 to be a sideways, complex correction such as a flat or a triangle. Conversely, if Wave 2 was sideways, Wave 4 is more likely to be sharp. This principle prevents traders from being chopped up by repeating the same entry strategy that worked in the previous cycle. It forces you to remain patient when the market shifts from a quick retracement to a time-consuming consolidation.
Applying these ratios correctly requires a disciplined approach to capital preservation. You can explore more about this in our guide on Elliott Wave Risk Management: Protecting Capital in 2026 Markets. If you want to see these Fibonacci targets applied to live charts in real-time, consider joining our Elliott Wave School to refine your identification skills under professional guidance.
Theory is only as good as its application in a live environment. To start a count effectively, you have to find a clear, major market peak or trough. Don’t make the mistake of trying to force a label onto price action in the middle of a range. Start with the highest timeframe possible to establish the dominant trend, then zoom into shorter intervals to find your entry point. This Elliott Wave patterns cheat sheet is your map, but you still have to read the terrain as it changes. Success comes from identifying where the “big picture” count aligns with the immediate price flow.
Different asset classes exhibit unique wave behaviors based on their underlying liquidity and participant psychology. Forex pairs are heavily influenced by central bank policy and macro liquidity, which often leads to range-bound price action. In these markets, you’ll frequently encounter complex corrections and truncated fifth waves where the price fails to move significantly past the end of Wave 3. You can explore these nuances in our EUR/USD Elliott Wave Analysis: Mastering the 2026 Market Cycle. It’s a prime example of how currency cycles differ from more speculative, trending assets.
Crypto markets follow a different rhythm. Because they’re driven by intense retail sentiment and FOMO, fifth waves are often the “extended” leg rather than the third. We saw this clearly in 2025 when Bitcoin completed a motive phase from $98,240 to $108,800. These extensions can blow through standard Fibonacci targets, making it essential to adjust your risk management accordingly. If you’re used to the shallow retracements of the S&P 500, the volatility of a digital asset’s Wave 2 might look like a total trend reversal rather than a simple correction.
Moving from a static Elliott Wave patterns cheat sheet to profitable execution requires the right tools. We recommend using an Elliott Wave Calculator to automate the math behind your retracements and extensions. This removes the emotional bias that often leads traders to see patterns that aren’t actually there. Once you’ve mastered the basic structures, the next logical step is structured learning. Our Elliott Wave School provides the deep-dive video lessons and real-time analysis needed to refine your counting skills under professional guidance.
For those looking to trade at a professional level, you can apply these techniques to secure prop capital. Our Funded Trader Program Guide outlines how to leverage wave analysis to manage significant capital. The Wavetraders approach focuses on combining rigid pattern recognition with live market flow, ensuring you’re trading what you see rather than what you hope for. We’re here to track these cycles with you, providing the clarity needed to stay calm and focused in even the most volatile 2026 market environments.
This Elliott Wave patterns cheat sheet serves as your foundational map for navigating the complex psychology of the financial markets. You’ve learned how to identify valid motive waves using the three cardinal rules and how to decipher the subtle internal rhythms of corrective structures. By applying Fibonacci ratios and understanding wave personalities, you can move beyond simple pattern recognition and start anticipating high-probability reversal zones with greater confidence.
The transition from theory to consistent profit requires practice and real-time validation. Since 2003, we’ve provided practitioner-led education and professional analysis across FX, crypto, and commodities to help traders refine their skills. Members receive real-time market updates to stay aligned with current wave counts as they develop. To move beyond the basics and develop professional-grade expertise, you can Master Wave Counting at the Wavetraders Elliott Wave School. We’re excited to track these evolving market cycles alongside you as you build your trading career.
The three unbreakable rules apply to standard impulse waves and serve as the primary validation for any count. First, Wave 2 must never retrace more than 100% of the first wave. Second, Wave 3 can never be the shortest of the three motive waves, which include waves 1, 3, and 5. Finally, Wave 4 cannot enter the price territory of Wave 1. If price violates any of these, your Elliott Wave patterns cheat sheet indicates the count is invalid.
Overlap between Wave 4 and Wave 1 is prohibited in a standard impulse wave, but it’s a defining characteristic of diagonal patterns. Leading and ending diagonals typically take a wedge shape where Wave 4 moves into the price zone of Wave 1. If you see an overlap in what you thought was a standard trend, you’re likely looking at a terminal pattern or a corrective structure rather than a clean impulse move.
The primary difference lies in the internal structure and the depth of the retracement. A zigzag is a sharp, 5-3-5 correction where Wave A is a five-wave motive move. Flats are sideways 3-3-5 structures where Wave A consists of only three waves. While zigzags often retrace 50% or more of the previous trend, flats tend to be shallower and indicate a market that is consolidating rather than reversing aggressively.
A wave count is wrong the moment price violates one of the core structural rules or moves beyond a logical Fibonacci invalidation level. For example, if you’ve labeled a move as a Wave 2 retracement and price drops below the start of Wave 1, the count is immediately void. Professional analysts use these invalidation points to manage risk, ensuring they don’t stay in a trade once the original pattern thesis is broken.
While several ratios are useful, the 1.618 extension is often considered the most critical because it typically identifies the target for a Wave 3. For retracements, the 0.618 level is the golden target where many Wave 2 or Wave B moves find their floor. Using an Elliott Wave patterns cheat sheet alongside these ratios helps you identify high-probability turning points where the mathematical structure of the market aligns with crowd psychology.
Elliott Wave theory is exceptionally effective in cryptocurrency markets because they’re driven largely by pure crowd sentiment. Digital assets like Bitcoin often exhibit highly extended fifth waves and clear fractal structures across timeframes. In 2025, Bitcoin’s move from $98,240 to over $108,800 perfectly validated the 5-3 motive structure. The high volatility in crypto provides the clear, impulsive swings that make wave counting a powerful tool for digital currency traders who track market flow.
A truncated fifth wave occurs when the final leg of an impulse fails to move beyond the peak of Wave 3. This typically happens after an exceptionally strong third wave has exhausted the market’s momentum. While it’s relatively rare, a truncation is a major warning sign that the trend is weak and a significant reversal is imminent. It’s often confirmed by a momentum divergence on technical indicators as the price fails to reach new highs.
The start of a new cycle is identified by a clear five-wave impulse move that breaks the trendline of the previous correction. This initial move, labeled as Wave 1, should be followed by a three-wave retracement that holds above the cycle low. Once this 1-2 setup is confirmed by price breaking the peak of Wave 1, you have high-probability evidence that a new motive phase has begun and the previous trend has officially shifted.
DISCLAIMER
Any reviews, news, analysis, prices or other information contained on our website is provided as general market commentary and delivered electronically through a distribution channel to larger number of clients, therefore does not constitute investment advice or investment research. We are not trading advisors. Most of our work is for educational purposes only, with information based on Elliott Wave theory in real time. Trading forex, futures, options, stocks, cryptocurrenices or any another trading market carries a high level of risk, and may not be suitable for all investors.
The possibility exists that you could lose some or all of your initial investment; therefore you should not invest money that you cannot afford to lose. Our website and the information that we provide should not be relied upon as a substitute for extensive independent research before making your investment decisions. In no event will we be liable for any loss or damage on your account in connection with, the use of our products. For any real cash investments you have to contact your financial advisor.
Any information or material contained on our website is owned by Val Global d.o.o.. Reproduction is prohibited without Val Global d.o.o. prior license in writing.
By continuing to use the site, you agree to the use of cookies. Learn more.
The cookie settings on this website are set to "allow cookies" to give you the best browsing experience possible. If you continue to use this website without changing your cookie settings or you click "Accept" below then you are consenting to this.