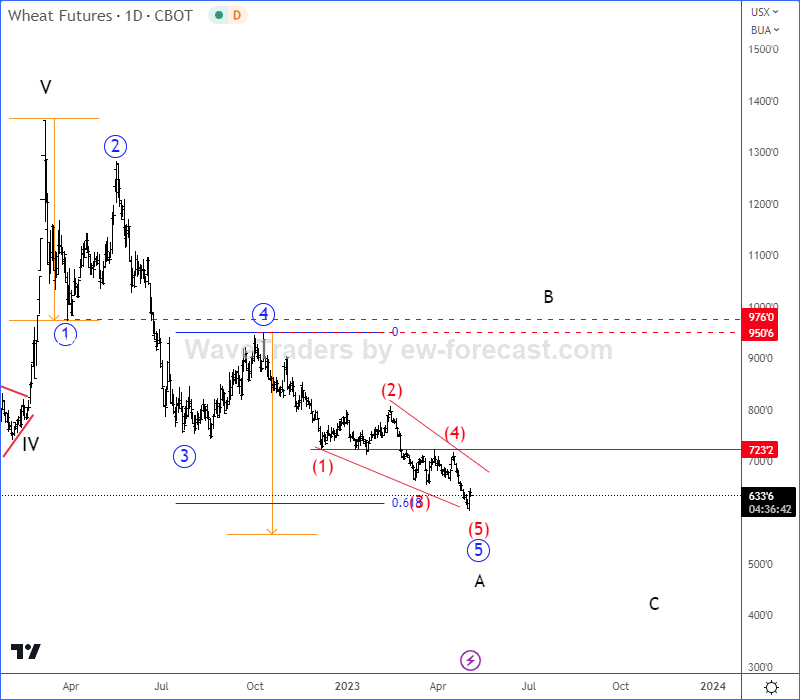
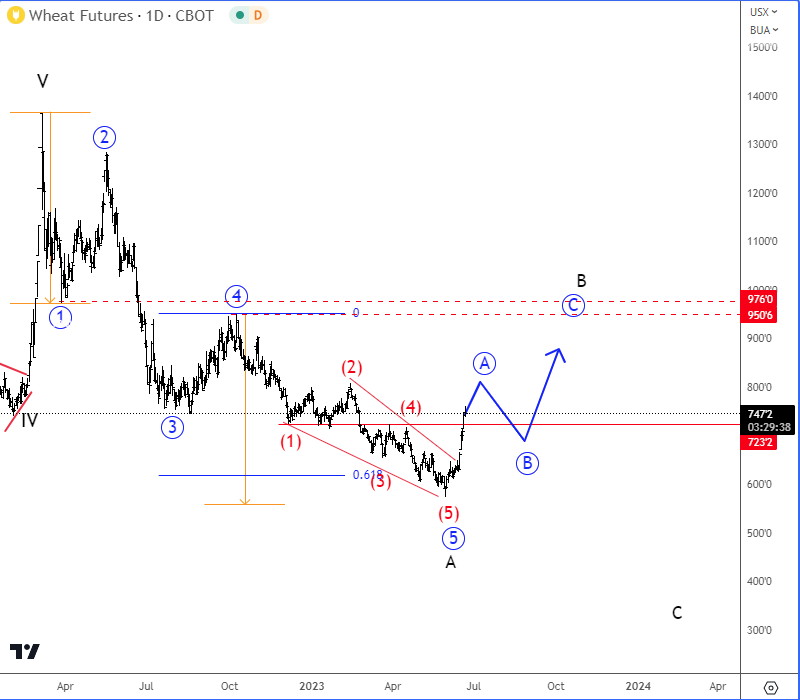
Wheat is recovering after a completed five-wave bearish cycle, as it’s breaking out of the wedge pattern from Elliott wave perspective.
Back on December 13th of 2022 we shared WHEAT weekly chart, in which we have been warning about the top and five-wave bearish impulse with an ongoing 5th wave of A. CLICK HERE
On May 4th we have spotted that WHEAT is finishing a five-wave bearish impulse from the highs with an ending diagonal (wedge) pattern for the 5th wave on a daily chart. Ending diagonal a.k.a. wedge pattern is a strong reversal pattern, indicating that support may not be far away, especially if we consider that a 5th wave is equal in length compared to wave 1. Five-wave decline from the highs is barely first leg A of a deeper, higher degree A-B-C corrective decline.

As you can see today, after almost two months, WHEAT is finally bouncing strongly and sharply on a daily chart, which looks like an impulse into first leg A of a three-wave A-B-C corrective rally within higher degree wave B. So, seems like WHEAT is going to stay in the recovery mode in the second part of 2023, which can send the price back to 900 – 1000 resistance zone before we will see further weakness for a higher degree wave C in 2024.

Become a premium member
Get daily Elliott Wave updates for US Single Stocks, SP500,DAX, GOLD, SILVER, CRUDE, FX, CRYPTO, etc. or apply for unlimited access to the Elliot Wave educational videos.