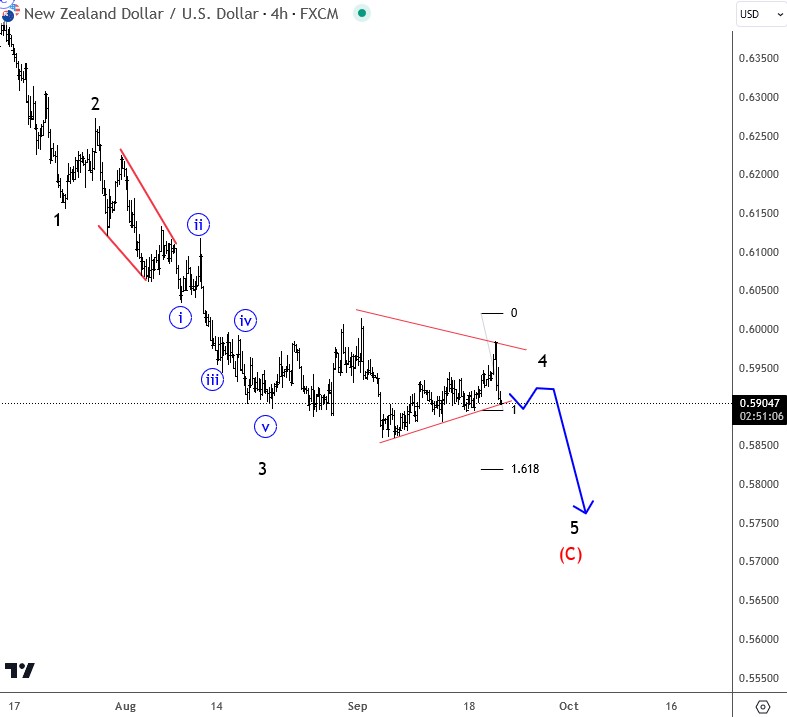
Kiwi with ticker NZDUSD is looking for lower support levels from technical point of view and by Elliott wave theory.
Kiwi with ticker NZDUSD is trading south for the last few weeks, but can be an impulsive wave C when looking a the daily chart, meaning that despite some strong leg down there can be a limited weakness and change in trend still this year. Wave (C) is a motive wave, so we need five subwaves down before the market can complete the current bearish sequence. Well, the market came to a new low recently, but it’s not clear if that’s wave 5 bottom or maybe will wave 4 be more complex, so we will have to wait on more price data first. Looking at the 4-hour chart there is actually a chance for a triangle in 4 or wedge pattern within wave 5 while the market trades below 0.6 resistance.

Become a premium member
Get daily Elliott Wave updates for US Single Stocks, SP500,DAX, GOLD, SILVER, CRUDE, FX, CRYPTO, etc. or apply for unlimited access to the Elliot Wave educational videos.
CADJPY Is Coming Higher Out Of Projected Bullish Triangle Pattern. Check our blog HERE.