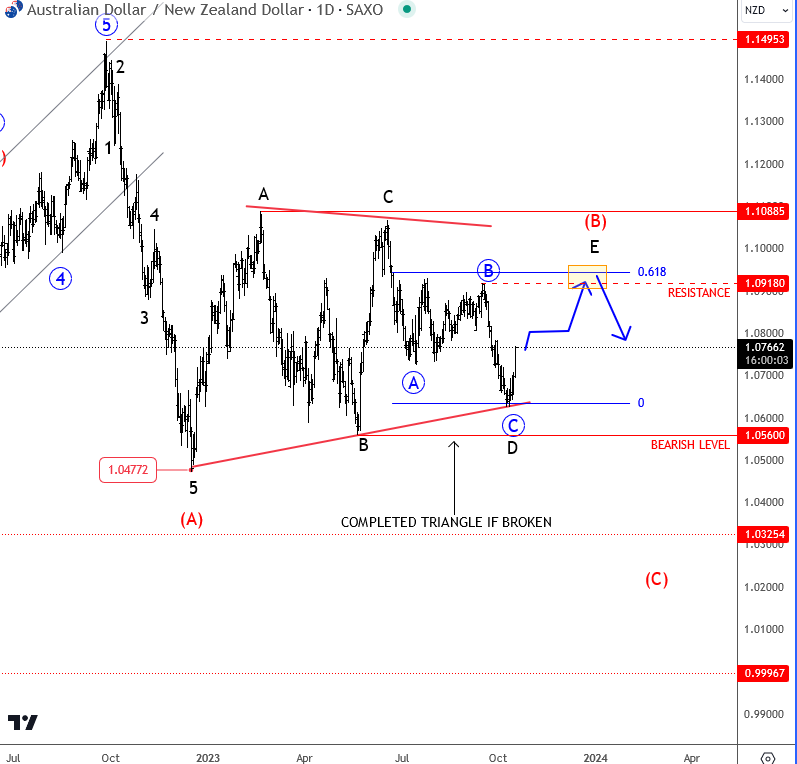
AUDNZD Is Forming A Bearish Triangle pattern from technical point of view and from Elliott wave perspective
RBA warns that further interest-rate increases may be needed if it sees signs that inflation isn’t under control. At the same time NZD CPI came out 5.6% vs 5.9% forecast, previous reading was 6%. It’s the perfect case for AUDNZD strength, but this one can be temporary.
From an Elliott Wave perspective AUDNZD turned sharply down in the last quarter of 2022, signaling the ending point of a higher-degree bullish structure. We talked about this in our 2022 updates and warned about a bearish turning point which is progress and will most likely resume much lower as pair shows an impulsive drop for wave (A). However, nothing moves in a straight line, so the current sideways price action is most likely wave (B) triangle formation that can take some time before we will see a bearish continuation into higher degree wave (C).
As expected actually, price revisited the lower side of a triangle range for subwave D, near 1.07 – 1.06 area, from where we can see a nice turn up so far, ideally into final wave E of (B). Perfect resistance for a completion of a pattern is at 1.09-1.0950 area. A break below 1.0560 will suggest that bears are already in play for 1.02-1.03.

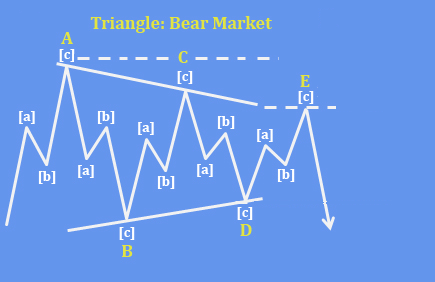
What exactly is a triangle pattern? A triangle is a continuation pattern characterized by A-B-C-D-E subwaves, with each leg containing corrective subdivisions. Typically, the breakout point occurs at the swing high of wave D in an uptrend or at the swing low in a downtrend. Until one side of the triangle is decisively breached, the price can remain trapped within this range for an extended period. Therefore, it’s essential to adapt your trading strategy between significant levels during this time.

Become a premium member
Get daily Elliott Wave updates for some major Digital currencies, FIAT currency markets, major stock indexes, gold, silver, crude etc. or apply for unlimited access to the Elliot Wave educational videos.
Crypto Market Can Be Finishing A Corrective Consolidation. Check our blog HERE.