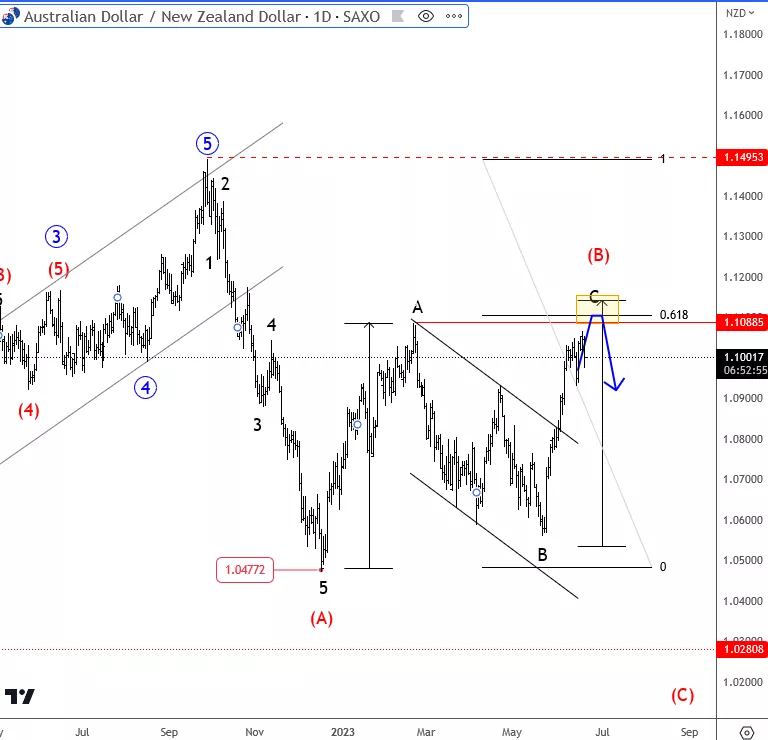
AUDNZD pair made an impulsive sell-off at the end of 2022 on a daily chart, which we see it as a wave (A). Since then, we can see it trading in a larger A-B-C corrective rally within wave (B) that can be now approaching important February highs resistance, from where we should be aware of another sell-off for a higher degree wave (C).
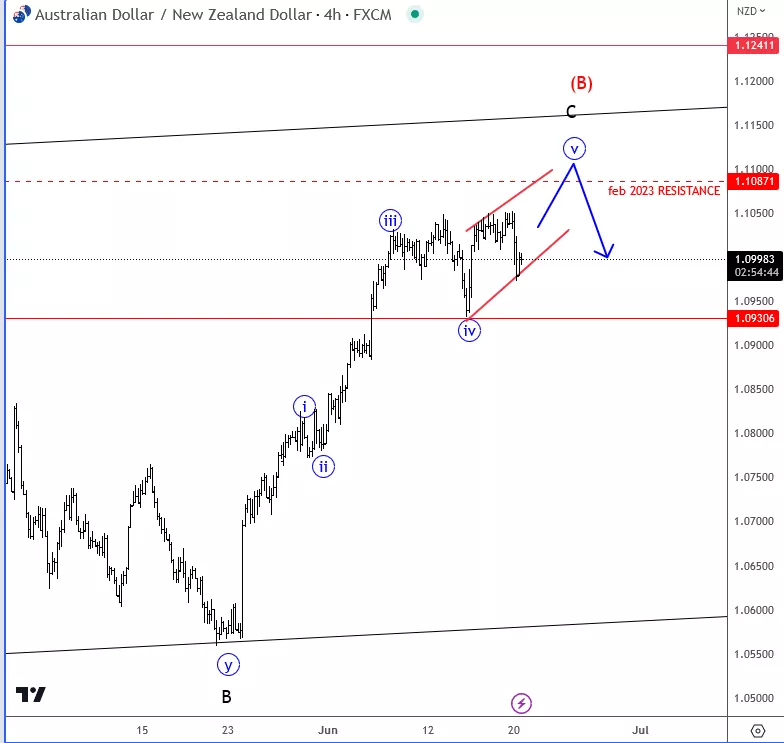
Looking at the 4-hour, we can see it finishing a five-wave impulse within wave C of (B) that can ideally stop above February highs in the 1.11 – 1.12 resistance zone. Currently we are tracking final stages of subwave »v« that can be potentially completed within the wedge pattern before we will see a bearish reversal.
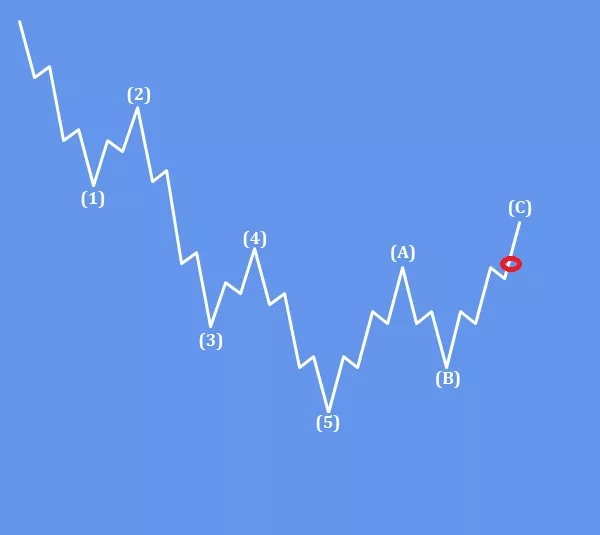
Basic Elliott wave pattern with an impulsive five-wave 1-2-3-4-5 decline, followed by a three-wave A-B-C correction indicates for more weakness.
Become a premium member
Get daily Elliott Wave updates for US Single Stocks, SP500,DAX, GOLD, SILVER, CRUDE, FX, CRYPTO, etc. or apply for unlimited access to the Elliot Wave educational videos.
US Stocks Are In A Bullish Impulse, But More Gains After A Correction. Check our blog HERE.