Stocks

US Stocks Are In A Bullish Impulse, But More Gains After A CorrectionJun 19, 2023

Markets have remained relatively stable since Friday, with the USD closing on a strong note as the ECB adopted a more hawkish stance compared to the Fed. The DXY has experienced a significant downward movement, reaching the week’s lows and indicating potential further decline. Consequently, stocks, cryptos, and XXX/USD pairs may continue their recovery mode after a temporary setback. However, please note that today is a holiday in the US, so we might need to wait for a few more sessions before a risk-on sentiment resumes.”

After the expiration of the June contract, the SP500 appears to have completed wave »v« of 3, suggesting the possibility of a corrective a-b-c slow down within the higher degree wave 4 in the new September contract. This correction could potentially retest the support area around 4425 – 4385 before a bullish continuation for wave 5.
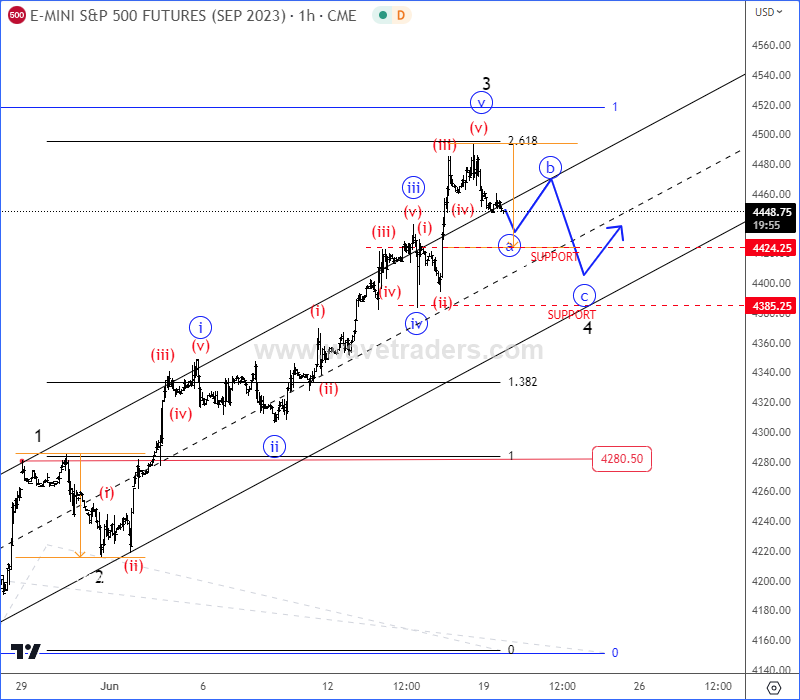
US Stocks Are In A Bullish Impulse, But More Gains After A Correction SP500 1H Chart
SP500 1H Chart

NASDAQ100 may have also completed an extended wave »iii«, so with an upcoming higher degree wave »iv« correction, there’s a chance it will retest 14700 – 14250 support zone before a continuation higher for wave »v« of 3.
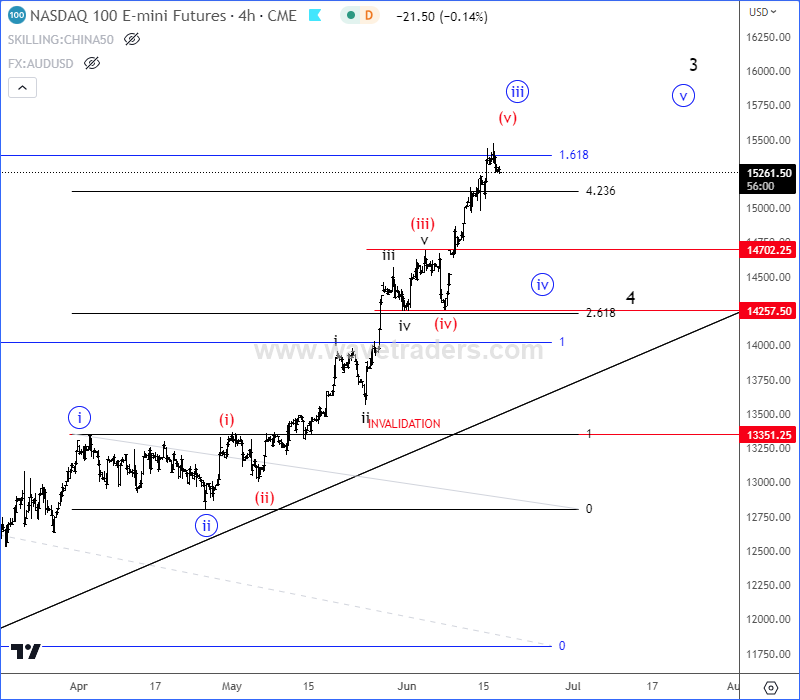
US Stocks Are In A Bullish Impulse, But More Gains After A Correction NASDAQ100 4H Chart
NASDAQ100 4H Chart

Impulse waves consist of five sub-waves that make a net movement in the same direction as the trend of the next-largest degree. Elliott Wave Theory is a method of technical analysis that looks for recurrent long-term price patterns that are related to persistent changes in investor sentiment and psychology.
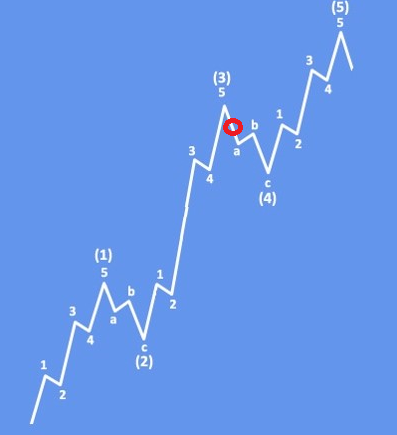
US Stocks Are In A Bullish Impulse, But More Gains After A Correction Elliott Wave Basic Impulse
Elliott Wave Basic Impulse

Become a premium member

Get daily Elliott Wave updates for SP500,DAX, GOLD, SILVER, CRUDE, FX, CRYPTO, etc. or apply for unlimited access to the Elliot Wave educational videos.

Bitcoin Is Technically Bullish And Supportive. Check our free chart HERE.

DISCLAIMER

Any reviews, news, analysis, prices or other information contained on our website is provided as general market commentary and delivered electronically through a distribution channel to larger number of clients, therefore does not constitute investment advice or investment research. We are not trading advisors. Most of our work is for educational purposes only, with information based on Elliott Wave theory in real time. Trading forex, futures, options, stocks, cryptocurrenices or any another trading market carries a high level of risk, and may not be suitable for all investors.

The possibility exists that you could lose some or all of your initial investment; therefore you should not invest money that you cannot afford to lose. Our website and the information that we provide should not be relied upon as a substitute for extensive independent research before making your investment decisions. In no event will we be liable for any loss or damage on your account in connection with, the use of our products. For any real cash investments you have to contact your financial advisor.

Any information or material contained on our website is owned by Val Global d.o.o.. Reproduction is prohibited without Val Global d.o.o. prior license in writing.

By continuing to use the site, you agree to the use of cookies. Learn more.

The cookie settings on this website are set to "allow cookies" to give you the best browsing experience possible. If you continue to use this website without changing your cookie settings or you click "Accept" below then you are consenting to this.

Close