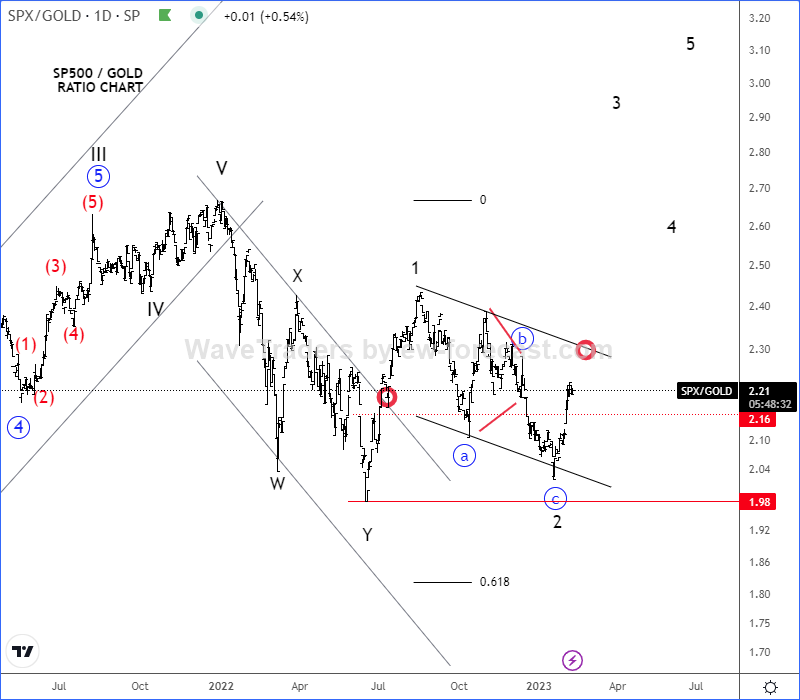
SP500 outperforms gold again, as we see SPX/GOLD ratio chart turning up again after a sideways consolidation.
Many markets are recovering rapidly since start of the year, such as stocks, metals and cryptocurrencies, while USD is losing its power. Well, seems like risk-on sentiment is back, at least for a temporary period of time, so we can expect bigger recovery this year, we just have to be aware of pullbacks.

Well, to find out which market is going to be strongest we usually take a look on ratio charts. In this article we decided to take a look on SPX/GOLD ratio chart (SP500 against gold). As you can see, SP500 is outperforming gold again after recent corrective consolidation within uptrend by Elliott wave theory with key 2.0 support level. SP500 is actually twice the price of gold and if stays so, then stocks could easily stay stronger the gold this year.

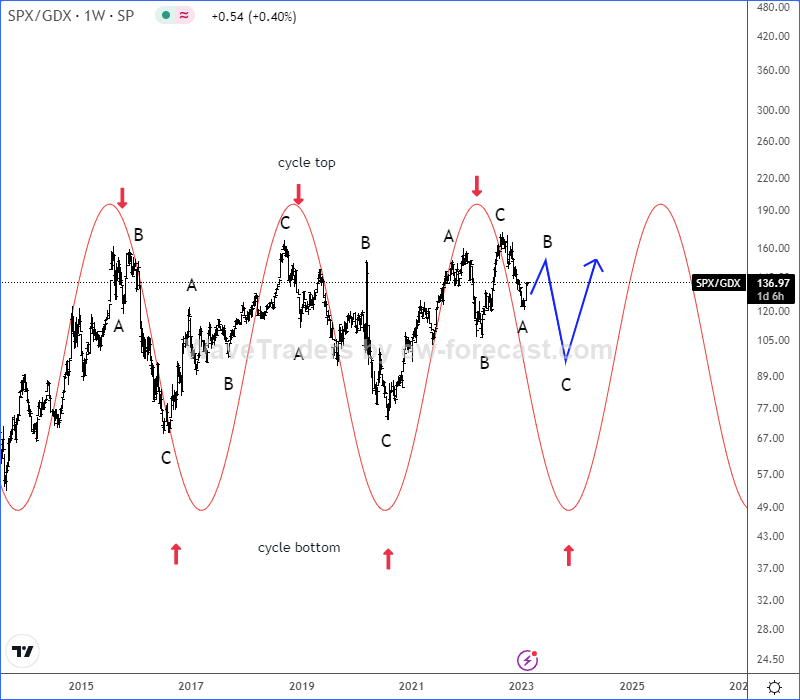
SPX/GDX ratio chart (SP500 against Gold miners) also shows an uptrend in favour of the SP500, but it may take some time till we will see a break out higher, as it can be still in the middle of weekly cycle bottom. Grega discussed in our Exclusive 2023 Elliott Wave Outlook. If you missed this one check it below:
Become a premium member
Get daily Elliott Wave updates for US Single Stocks, SP500,DAX, GOLD, SILVER, CRUDE, FX, CRYPTO, etc. or apply for unlimited access to the Elliot Wave educational videos.
MARA Shows A Completed Correction That Is Positive For Crypto. Check free chart HERE