Hello traders, today we want to share EURAUD currency pair. We will talk about its price action from technical point of view and wave structure from Elliott wave perspective.
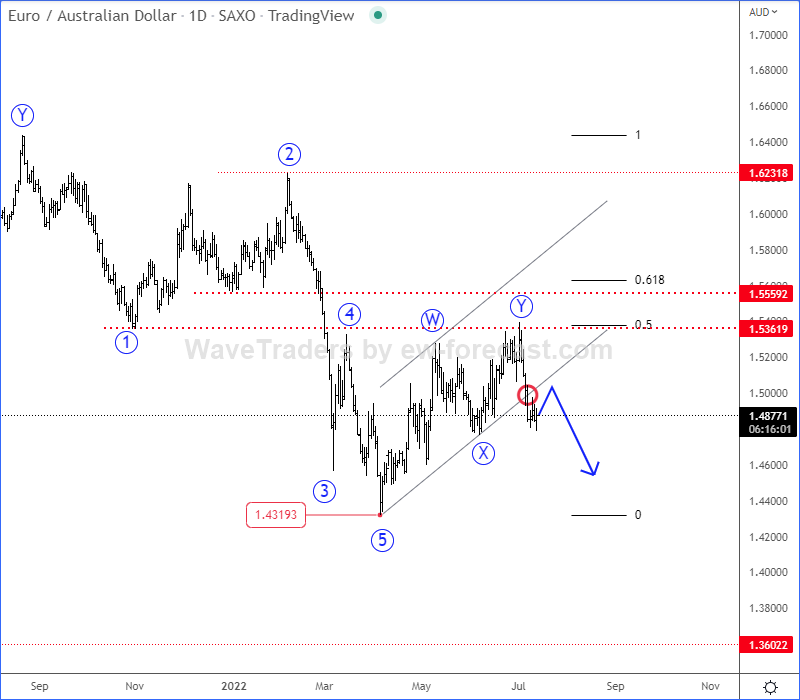
Looking at the daily chart, we can clearly see a bearish development. There’s a five-wave bearish impulse and complex W-X-Y corrective rally. It found resistance in the ideal previous wave 1 swing low, former wave 4 swing high and 50% Fibonacci area.

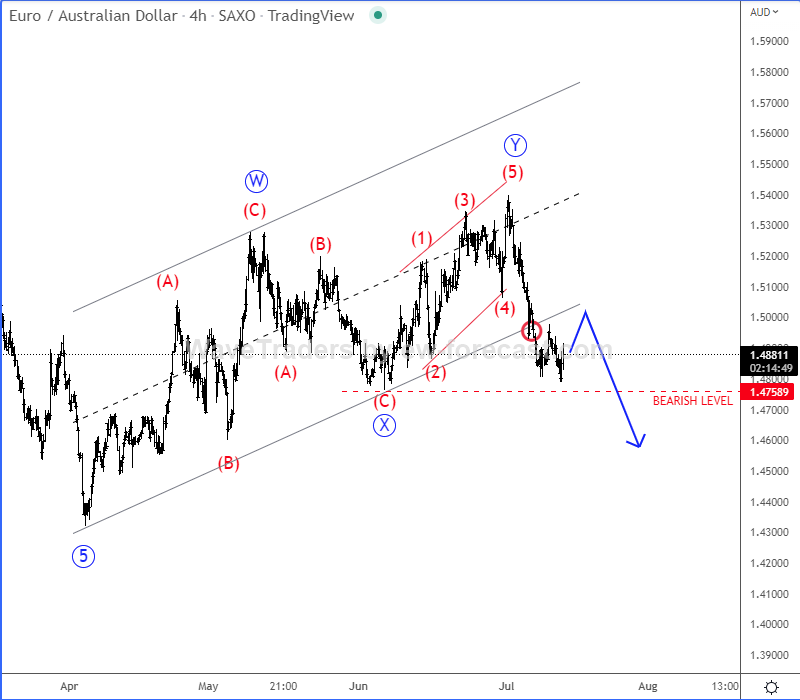
If we take a look at the 4-hour chart, we can see slow, choppy and overlapped wave structure that indicates for a corrective movement. We see it as a completed complex W-X-Y corrective rally, especially after recent sharp and impulsive sell-off back below channel support line, which confirms a bearish resumption.

From Elliott wave perspective, we believe there’s room for much more weakness within a new five-wave bearish impulse, especially if stocks find the strong support and start recovering. From technical point of view, broken channel support line suggests a bearish continuation, so once EURAUD starts breaking below 1.4758, this is when we may see an acceleration to the downside, we just have to be aware of short-term corrective pullbacks.
Happy trading!
Cryptocurrencies look attractive again. Check our MATIC chart HERE