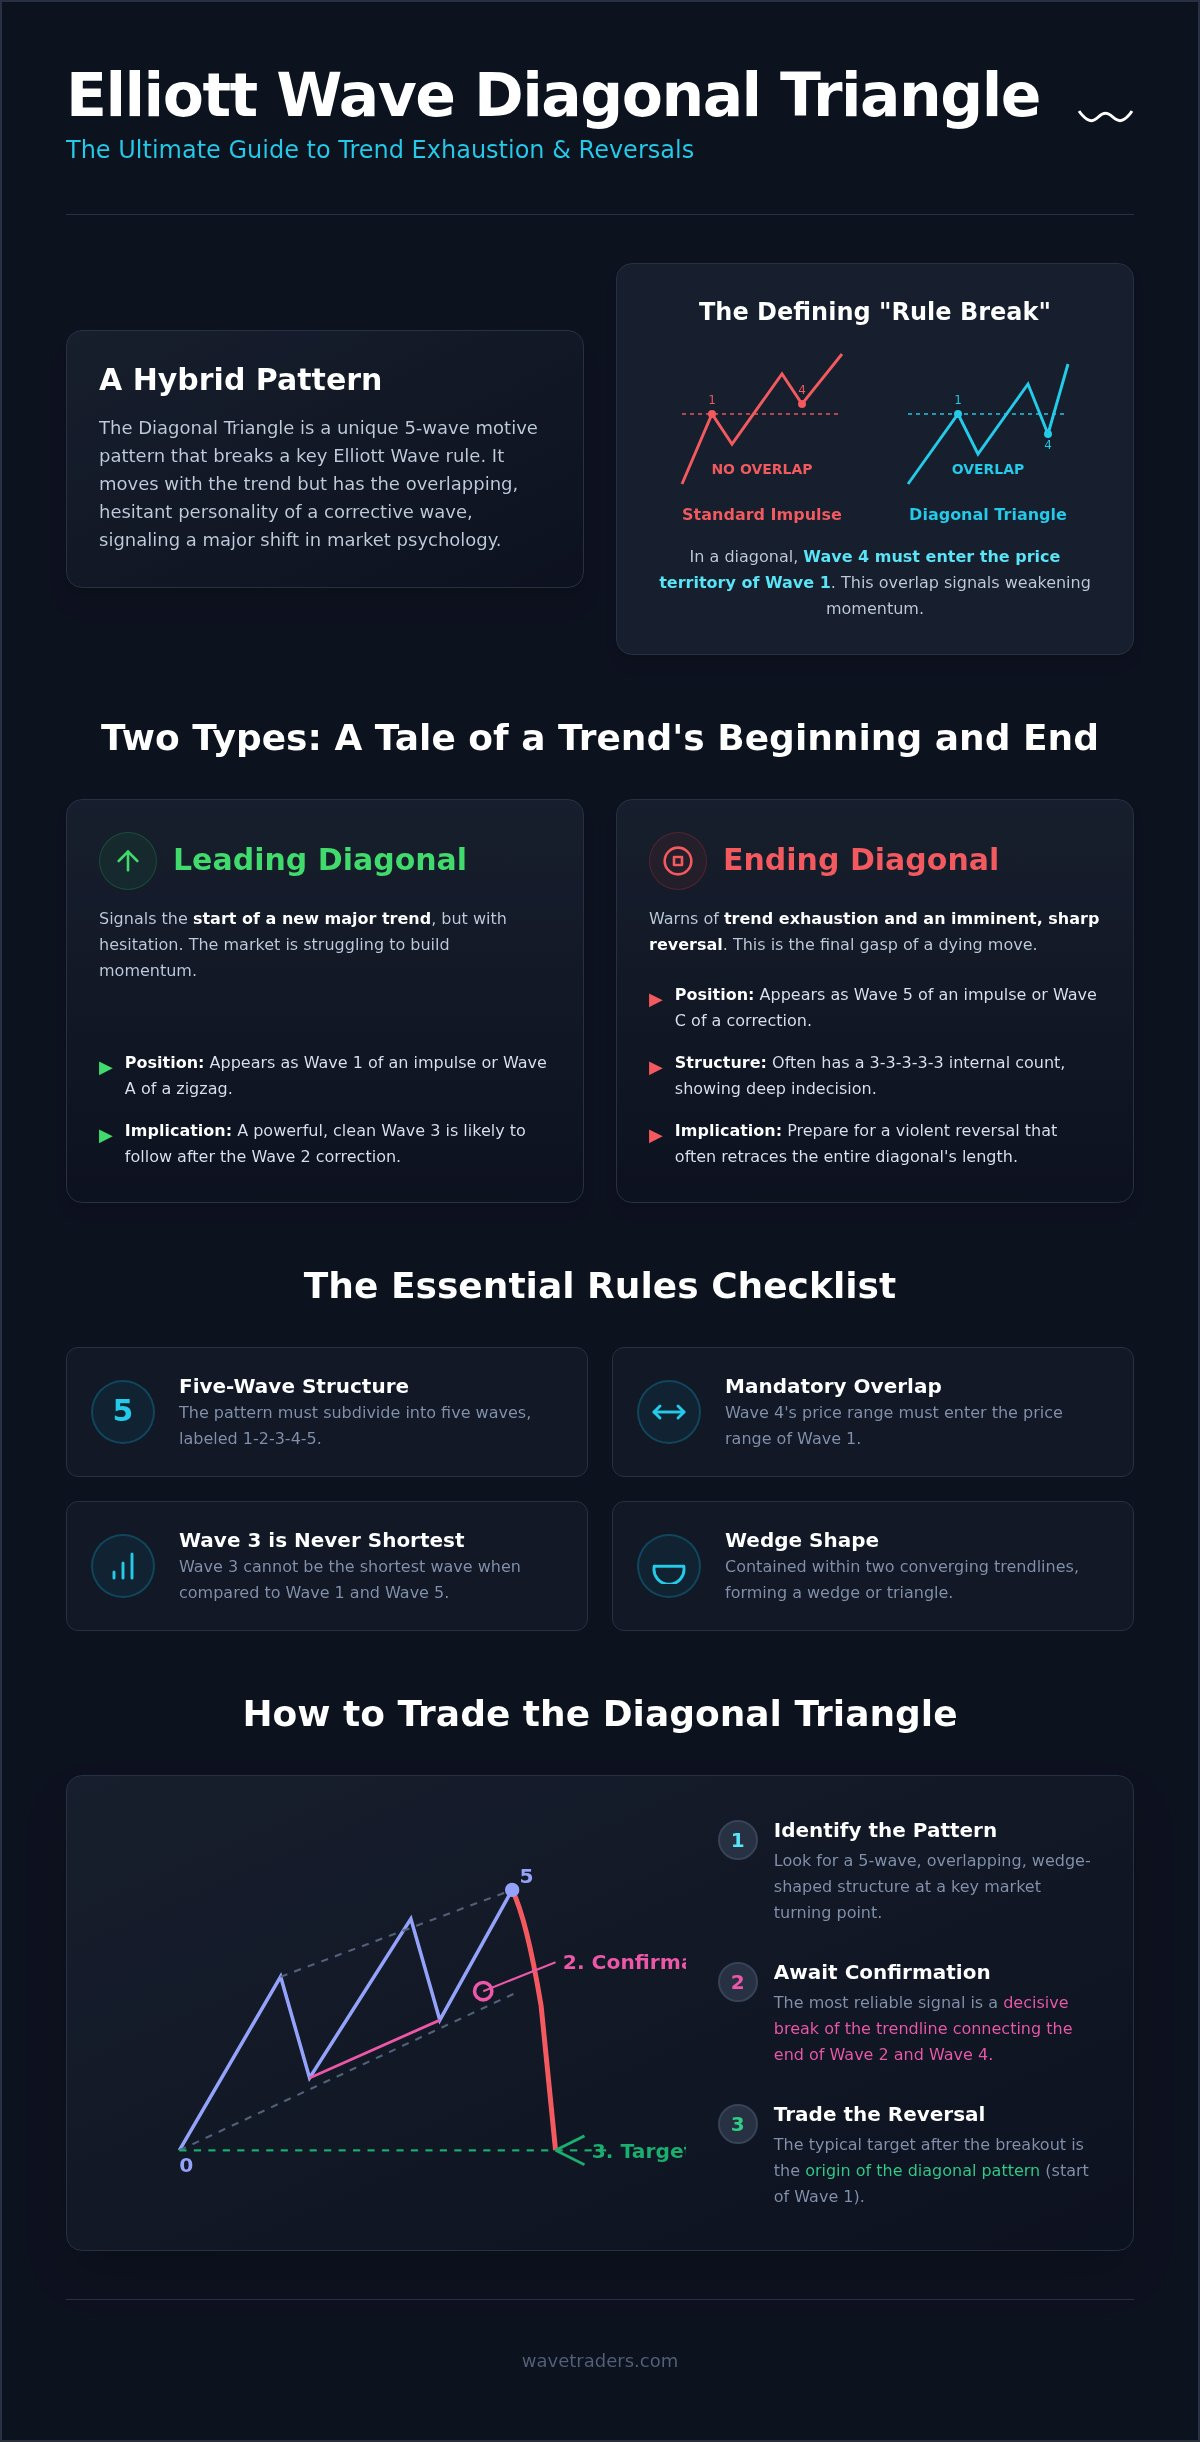
Most traders are taught that Wave 4 must never enter the price territory of Wave 1, but the Elliott Wave diagonal triangle is the exception that proves the rule. It is a unique motive pattern that intentionally breaks the standard guidelines of impulse waves, often appearing when a trend is either exhausted or just finding its feet. If you have ever felt the frustration of a clean trend suddenly turning into a messy, overlapping wedge, you are likely looking at a diagonal rather than a mistake in your analysis.
It is easy to feel confused when price action defies the “no overlap” rule, or to mistake these patterns for standard triangles. This confusion often leads to missed opportunities or, worse, being caught on the wrong side of a violent market reversal. We understand that mastering these nuances is what separates a novice from a seasoned practitioner. This article provides you with a clear, rule-based framework to identify these patterns before they complete.
You will learn to distinguish leading from ending diagonals and discover how to use tools like the Elliott Wave Calculator to project precise targets. We will also outline actionable trading strategies to help you anticipate the sharp reversals that typically follow these structures. By the end, you will have the confidence to track these complex moves and apply them within your own trading plan.
The Elliott Wave diagonal triangle is a specific type of motive pattern that often leaves traders scratching their heads. While most motive waves move with clean, sharp pulses, the diagonal takes a more hesitant path. It still moves in the direction of the primary trend, but it does so with significant internal overlap. This pattern is essentially a hybrid; it maintains the five-wave requirement of a motive wave while adopting the overlapping personality of a correction.
Understanding where this fits requires a look at the broader Elliott wave principle, which categorizes all market movements as either trend-reinforcing or trend-correcting. Diagonals are trend-reinforcing, but they signal that the trend is either just starting with difficulty or is about to come to a grinding halt. Recognizing these patterns early allows you to prepare for the volatile shifts that typically follow their completion.
Traders often struggle with diagonals because they look like corrections but act like motive waves. We label them 1-2-3-4-5, yet their internal structure is frequently composed of three-wave sequences. This is a stark contrast to an Elliott Wave zigzag pattern, which is a clear three-wave corrective move (A-B-C). In a diagonal, the market is making progress, but the conviction isn’t as strong as it is in a standard impulse wave.
The psychological shift here is profound. In an ending diagonal, the aggressive trend-following momentum is dying. Buyers and sellers are fighting for every inch of ground, leading to the overlapping waves. It’s the market’s way of showing exhaustion before a major reversal. Mastering these nuances is a core part of our curriculum at the Elliott Wave School, where we help traders identify these psychological shifts in real-time charts.
Many technical analysis resources use the terms “diagonal” and “wedge” interchangeably, but the “triangle” part of the name comes from the visual geometry. As the pattern progresses, the peaks and troughs are contained within two boundary lines. In a contracting diagonal, these lines converge toward a future apex, creating a triangular shape. While expanding diagonals exist where the lines diverge, the contracting version is far more common in liquid markets.
The most critical geometric component is the 2-4 trendline. This line connects the ends of waves 2 and 4. It acts as the final support or resistance level for the pattern. A clean break of this line often validates that the Elliott Wave diagonal triangle is complete, opening the door for a sharp move in the opposite direction. Identifying this “wedge” shape helps you differentiate it from a standard impulse wave, where the price action is usually much more linear and aggressive. This distinction is vital for traders aiming for the Funded Trader Program, where precision in pattern recognition is a requirement for success.
While the fundamental rules of an Elliott Wave diagonal triangle apply to both variations, their internal structures and market implications differ significantly. You’ll find these patterns at opposite ends of a trend. A leading diagonal signals the start of a move, while an ending diagonal marks its conclusion. Understanding the wave degree and the specific sub-wave counts is essential for accurate forecasting.
Market psychology plays a major role here. In a leading diagonal, the market is struggling to give birth to a new trend. In an ending diagonal, the market is fighting to maintain a trend that has run out of steam. These two scenarios create distinct visual signatures that you can learn to identify with practice.
The ending diagonal is perhaps the most famous pattern in technical analysis. It typically appears in the Wave 5 position of an impulse or the Wave C position of a correction. Its internal structure is almost always a 3-3-3-3-3 count. This means every sub-wave, including the motive waves 1, 3, and 5, is actually a corrective three-wave move. It reflects a market that is gasping for air, making marginal new highs or lows with very little conviction.
Contrarian traders watch these structures closely. The completion of an ending diagonal often leads to a “fast and sharp” reversal. Once the 2-4 trendline is broken, the price usually retraces to the origin of the diagonal in a fraction of the time it took the pattern to form. We often see this play out in our EUR/USD Elliott Wave analysis, where a terminal wedge can signal a major trend shift for the year. If you want to see how these patterns look in live markets, our FX Service provides daily updates on these setups.
Leading diagonals occur at the start of a move, specifically in Wave 1 or Wave A. Unlike the ending variety, a leading diagonal often features a 5-3-5-3-5 internal count. This means waves 1, 3, and 5 are small five-wave motive sequences, though they still overlap. It represents a market trying to establish a new direction while still facing heavy resistance from the previous trend’s participants.
Identifying a leading diagonal is useful for forecasting the subsequent Wave 2 correction. These corrections are typically deep, often retracing 61.8% or even 78.6% of the diagonal’s length. If you spot a leading diagonal early, you can prepare for a deep pullback before the explosive Wave 3 begins. This pattern serves as a “heads up” that the market environment is shifting from a correction to a new motive phase.
To trade the Elliott Wave diagonal triangle effectively, you must first understand the hard rules that define its structure. Unlike a standard impulse wave, which follows the strict the 3 rules of Elliott Wave, the diagonal is a more flexible but still disciplined pattern. The most defining characteristic is the overlap rule. In a diagonal, Wave 4 must move into the price territory of Wave 1. This is the only motive structure where this overlap is a requirement rather than a mistake in the count.
Another non-negotiable rule is the Wave 3 constraint. Just like in a standard impulse, Wave 3 within a diagonal can never be the shortest when compared to waves 1 and 5. If your count shows Wave 3 as the smallest of the three motive waves, the pattern is likely something else. In most contracting diagonals, we expect to see a sequence of diminishing waves, where Wave 1 is the longest, followed by Wave 3, and then Wave 5.
The suspension of the “no overlap” rule is what often leads to confusion among newer traders. If you see price action overlapping in what looks like a five-wave move, you aren’t necessarily looking at a correction. It may be an Elliott Wave diagonal triangle forming. This is where having the Elliott Wave degree explained becomes invaluable. By checking the sub-waves on smaller timeframes, you can verify if the internal structure matches the leading or ending diagonal requirements we discussed earlier.
A common pitfall is misidentifying a series of 1-2, 1-2 moves as a diagonal. If the overlap is deep and the momentum is sluggish, a diagonal is probable. If the price action is explosive, you are likely looking at nested impulse waves. Distinguishing between these scenarios is a key focus in our Elliott Wave School curriculum, where we help you separate genuine patterns from market noise.
While rules are absolute, guidelines help you increase the probability of a successful trade. Fibonacci relationships are particularly useful here. Wave 3 frequently reaches the 61.8% or 78.6% level of Wave 1. Additionally, you should watch for momentum divergence. As Wave 5 completes, oscillators like the RSI typically show a lower peak than Wave 3, indicating that the trend is losing its underlying strength. Sometimes, Wave 5 may even truncate, failing to reach the upper boundary line, which signals extreme exhaustion. The 2-4 trendline break is the primary validation for a diagonal completion.
Trading the Elliott Wave diagonal triangle requires a patient, methodical approach. Because these patterns often represent the final gasp of a trend, the reversals that follow can be incredibly fast. The most reliable entry strategy involves waiting for a clean break of the 2-4 trendline. This line connects the ends of waves 2 and 4; its breach serves as confirmation that the diagonal structure is complete and the market is shifting direction.
For an ending diagonal, your primary price target is the origin of the pattern, which is the start of Wave 1. In many cases, the market will retrace the entire diagonal in less time than it took to form. Stop loss placement should be logical and data-driven. Typically, you place your stop just beyond the extreme of Wave 5. If the price moves past that point, your pattern count is likely invalidated, and it’s time to re-evaluate the market context.
A common phenomenon in these structures is the “throw-over,” where the price briefly spikes past the 1-3 boundary line before reversing sharply. This can trick aggressive traders into thinking the trend is accelerating. By waiting for the 2-4 trendline break, you avoid being caught in these false breakouts. Managing these trades is particularly important when a diagonal forms the final leg of an Elliott Wave flat correction. In this scenario, the reversal doesn’t just end a wave; it often kicks off a massive move in the opposite direction.
While ending diagonals get most of the attention, leading diagonals provide excellent setups for catching powerful Wave 3 moves. Once a leading diagonal completes, you should look for a Wave 2 correction to enter. These pullbacks typically reach the 50% to 61.8% Fibonacci retracement levels. Entering at these levels allows for tight stop losses and massive reward-to-risk ratios, which is exactly the kind of precision required to succeed in a Funded Trader Program. If you want to refine these entries, our Elliott Wave School provides the tools to master these setups.
Applying the rules of an Elliott Wave diagonal triangle to a static chart is a helpful exercise, but the real challenge lies in identifying these structures as they unfold in live markets. At Wavetraders, we focus on helping you bridge the gap between textbook theory and actual execution. Our Elliott Wave School provides a structured curriculum that simplifies these complex counts, turning what looks like market noise into a clear, actionable roadmap.
Precision is vital when trading diagonals, especially when you’re projecting price targets for an ending structure. We use the Elliott Wave Calculator to determine high-probability reversal zones based on Fibonacci relationships. This mathematical approach removes the guesswork, allowing you to set targets at the diagonal’s origin or specific extension levels with quiet confidence. For those currently navigating a Funded Trader Program, this level of accuracy is essential for managing drawdowns and hitting profit targets during volatile reversals.
We believe the best way to learn is by watching an experienced professional analyze the markets in real time. Our analysts have been active in the markets since 2003, and we bring that longevity to every video lesson and chart update. You aren’t just consuming content; you’re joining a community of traders who are tracking the same wave structures across FX, crypto, and commodities.
This practitioner-teacher approach ensures that you understand the “why” behind every count. Whether we are looking at a leading diagonal in the Digital Currency Service or an ending wedge in our FX Service, the goal is always to provide a considered opinion grounded in the methodology.
If you’re ready to move past the confusion of overlapping waves, the next step is to immerse yourself in a structured learning environment. Our membership provides daily analysis and real-time updates, ensuring you never have to track the markets alone. We invite you to explore our resources and see how a disciplined application of the Elliott Wave principle can transform your trading results.
Join Wavetraders today and master the diagonal triangle in real-time markets!
Mastering the Elliott Wave diagonal triangle is about recognizing the precise moment where market conviction shifts. Whether you’re identifying the birth of a trend with a leading diagonal or preparing for a sharp reversal after an ending structure, these patterns provide a unique edge that standard impulse waves cannot offer. You now have a clear framework for identifying overlaps, validating the 2-4 trendline, and setting targets that align with market reality.
At Wavetraders, we’ve provided real-time analysis since 2003 to help our community navigate these complex cycles. Our expert-led Elliott Wave School and dedicated support for participants in a Funded Trader Program ensure you have the technical foundation to succeed. We invite you to move beyond theory and see how these patterns develop in live markets every day. It’s this practical application that turns technical rules into a professional trading edge.
Master Elliott Wave patterns with Wavetraders, Apply for Membership
The path to consistent results starts with disciplined pattern recognition and a commitment to the methodology. We look forward to tracking the next major market move alongside you.
A diagonal is a motive pattern that moves the market in the direction of the larger trend. A standard triangle is a corrective pattern that represents a pause or sideways consolidation. While both have triangular shapes, diagonals consist of five waves labeled 1-2-3-4-5, whereas triangles consist of five waves labeled A-B-C-D-E. Diagonals move price forward, while triangles prepare the market for the next move.
No, a diagonal cannot occur in the Wave 3 position. The Elliott Wave diagonal triangle is restricted to the beginning or the end of a sequence, specifically Wave 1, Wave 5, Wave A, or Wave C. Wave 3 must always be a standard impulse wave to ensure the trend has sufficient momentum to sustain itself. If you see overlap in a Wave 3, your count is likely incorrect.
Yes, the 3-3-3-3-3 sub-wave count is a requirement for an ending diagonal. This means that waves 1, 3, and 5 are all corrective three-wave moves rather than five-wave impulses. This internal structure is what signals the exhaustion of the trend. Leading diagonals are different as they often feature a 5-3-5-3-5 count, although they still maintain the essential overlap between waves 1 and 4.
Traditional technical analysis treats a wedge as a visual shape, but Elliott Wave analysis requires a specific internal count. To be a diagonal, the pattern must have five distinct waves that follow strict rules. For example, Wave 3 cannot be the shortest wave. Traditional TA often ignores these internal dynamics; however, Elliott Wave provides a more disciplined framework to confirm if the wedge is actually a valid motive pattern.
Completion of an ending diagonal usually triggers a dramatic and swift reversal in price. The market typically returns to the origin of the diagonal, which is the start of Wave 1. This retracement often happens in a fraction of the time the diagonal took to form. It’s one of the most reliable signals for a trend change, which is why contrarian traders watch these structures so closely.
Overlap occurs because the market lacks the clear conviction found in a standard impulse. In an Elliott Wave diagonal triangle, the overlapping waves represent a struggle between buyers and sellers. This typically happens when a trend is just beginning to find its footing or when it’s completely exhausted and losing its directional strength. The overlap is the physical manifestation of that market indecision.
Yes, diagonals can be either contracting or expanding. While the contracting variety is much more frequent in liquid markets, expanding diagonals do appear when volatility increases as the pattern progresses. In an expanding diagonal, each subsequent wave is larger than the previous one; the boundary lines move further apart rather than converging toward an apex. All other rules, including the overlap requirement, still apply.
Diagonals are exceptionally useful in crypto markets because of the extreme exhaustion phases seen in digital assets. When an ending diagonal appears on a high-timeframe crypto chart, it often precedes a significant market correction or a total trend reversal. Many traders use these patterns to time their exits or entries in volatile assets like Bitcoin, where exhaustion signals are often followed by vertical price moves.
DISCLAIMER
Any reviews, news, analysis, prices or other information contained on our website is provided as general market commentary and delivered electronically through a distribution channel to larger number of clients, therefore does not constitute investment advice or investment research. We are not trading advisors. Most of our work is for educational purposes only, with information based on Elliott Wave theory in real time. Trading forex, futures, options, stocks, cryptocurrenices or any another trading market carries a high level of risk, and may not be suitable for all investors.
The possibility exists that you could lose some or all of your initial investment; therefore you should not invest money that you cannot afford to lose. Our website and the information that we provide should not be relied upon as a substitute for extensive independent research before making your investment decisions. In no event will we be liable for any loss or damage on your account in connection with, the use of our products. For any real cash investments you have to contact your financial advisor.
Any information or material contained on our website is owned by Val Global d.o.o.. Reproduction is prohibited without Val Global d.o.o. prior license in writing.
By continuing to use the site, you agree to the use of cookies. Learn more.
The cookie settings on this website are set to "allow cookies" to give you the best browsing experience possible. If you continue to use this website without changing your cookie settings or you click "Accept" below then you are consenting to this.