Most traders see a break above a previous high as a signal of trend strength, but in a corrective environment, it’s often the final trap before a sharp reversal. You’ve likely experienced the frustration of being stopped out by an expanded flat just as your original market thesis begins to prove correct. This confusion typically stems from miscounting the internal 3-3-5 structure or failing to distinguish between regular, expanded, and running variations. Identifying an Elliott Wave flat correction requires a methodical approach, as these patterns are designed to shake out weak hands before the primary trend resumes.
We understand that market structure can feel opaque when price action turns sideways. This guide will provide you with clear, objective rules for identifying each sub-wave and establishing specific Fibonacci targets for Wave C. You will learn how to read the signature of a flat with confidence, which helps you avoid common pitfalls and time your entries with precision. We’ll walk through a repeatable process for trading the eventual breakout, ensuring you can approach these complex structures as a professional practitioner rather than a reactive participant.
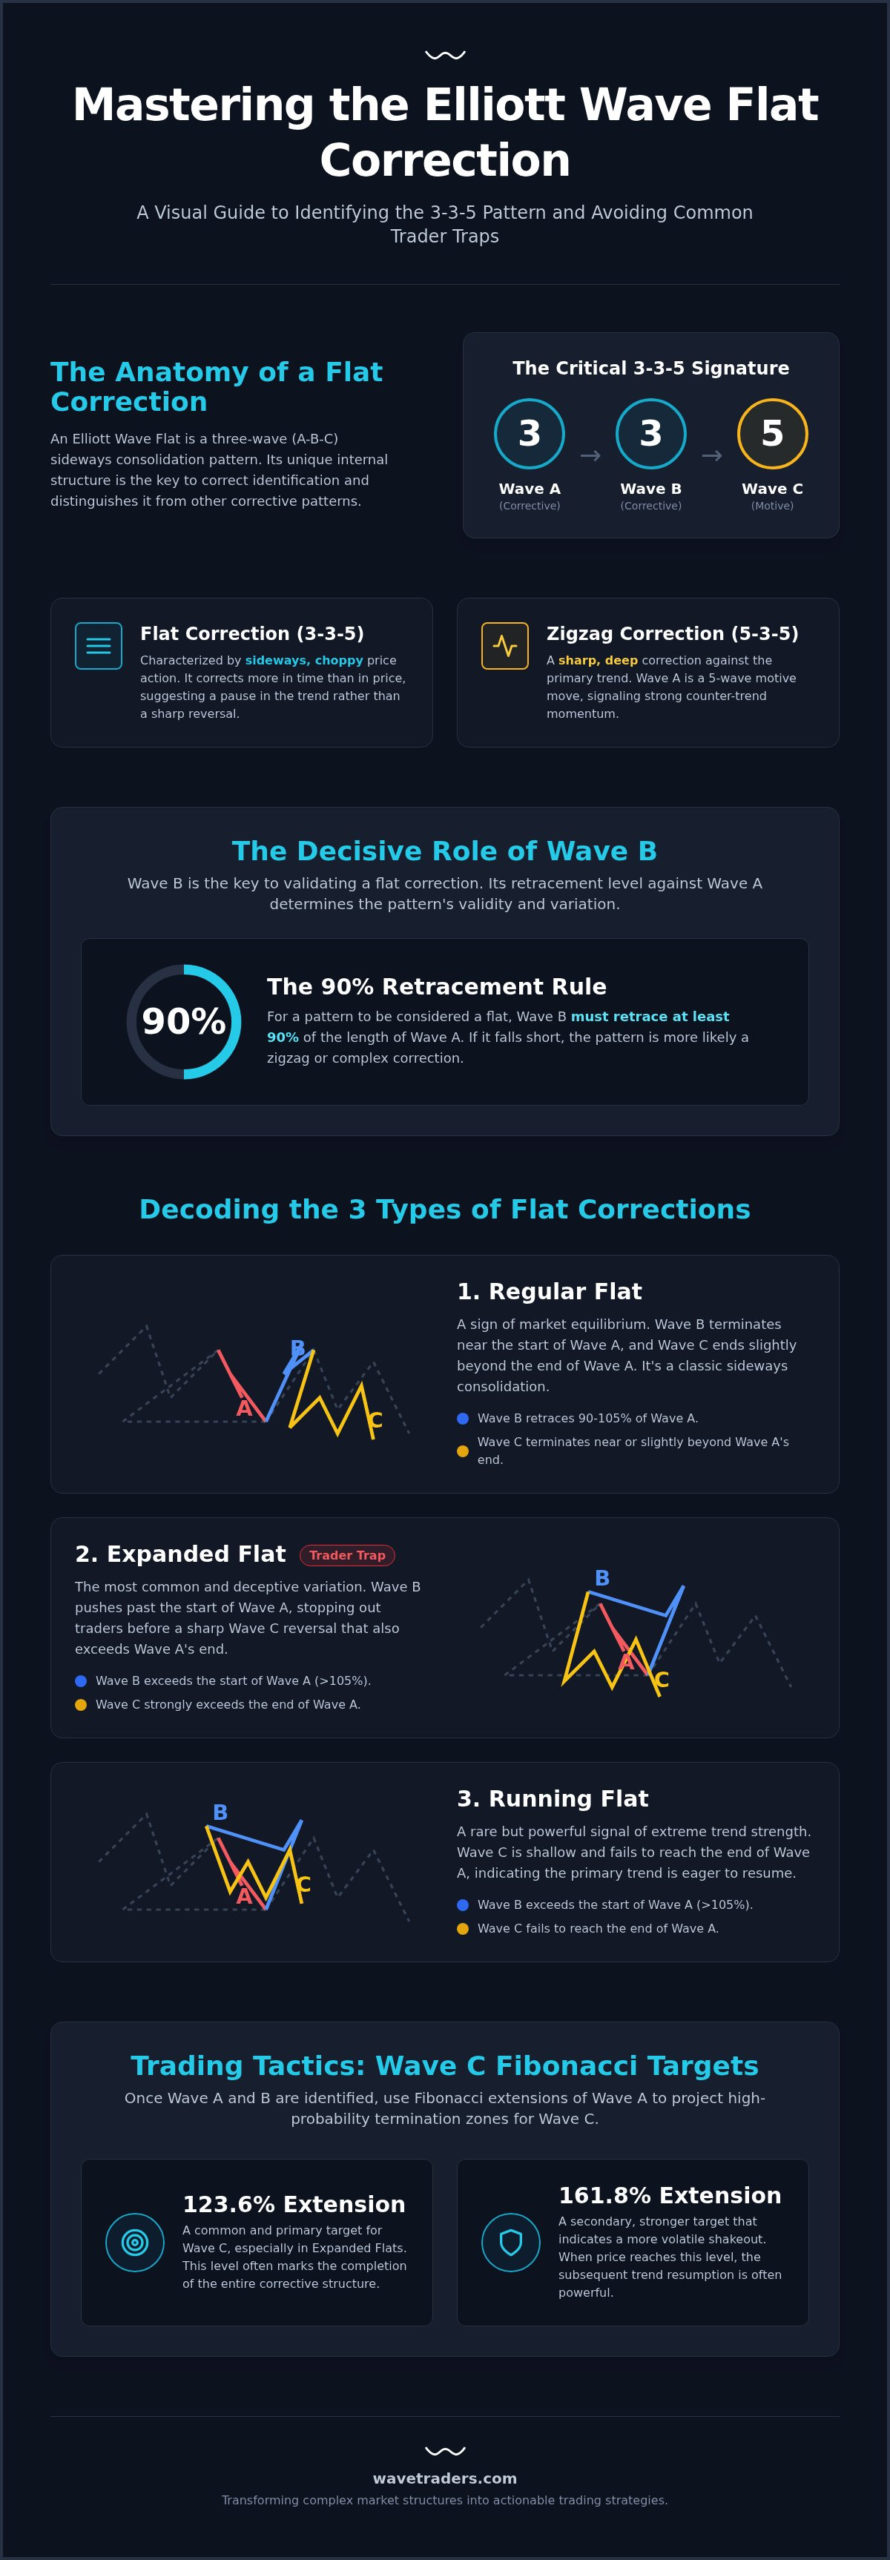
The Elliott Wave flat correction is a sideways, three-wave pattern that typically serves as a consolidation phase within an ongoing trend. Labeled as A-B-C, this structure behaves differently than other corrective forms because of its internal 3-3-5 signature. In this configuration, both Wave A and Wave B are composed of three sub-waves, indicating a lack of directional conviction. Wave C, however, is a motive five-wave move that completes the pattern. This specific sequence is a fundamental component of the Elliott Wave Principle, representing a period where the market pauses to digest previous gains or losses.
From a psychological perspective, flats emerge when trend-followers and counter-trend traders reach a temporary equilibrium. Neither side possesses enough momentum to dictate a new direction, resulting in the sideways price action that characterizes this pattern. These structures are essential for maintaining the Elliott Wave degree explained in market fractals, as they allow the market to correct in time rather than just in price. By moving sideways, the market builds the necessary energy to resume the larger trend once the correction is complete.
Distinguishing between a flat and a zigzag is a vital skill for any serious analyst. While a zigzag follows a 5-3-5 internal structure, an Elliott Wave flat correction uses the 3-3-5 sequence. This difference is not merely academic. Because Wave A of a flat is only three waves, it warns the trader that the market is not yet ready for a sharp, deep correction. Zigzags are typically aggressive and deep. Flats, by contrast, are choppy and sideways. They often retrace a smaller portion of the preceding impulse move, making them “time” corrections rather than “price” corrections. Knowing this prevents early entries that often get caught in the overlapping waves of a developing flat. When price action begins to overlap in a wedge-like formation at the end of a trend, it is also worth considering whether you are observing an Elliott Wave diagonal triangle rather than a corrective flat structure.
In a flat pattern, Wave B plays a decisive role in determining the variation we’re likely to see. For a correction to be classified as a flat, Wave B must retrace at least 90% of Wave A. If Wave B falls short of this level, the pattern is likely a zigzag or a complex combination. When Wave B exceeds the starting point of Wave A, it signals an expanded flat, which is a common trap for those expecting a simple reversal. The 90% rule serves as the primary filter to validate that a sideways consolidation is indeed a flat correction.
While every Elliott Wave flat correction shares the same 3-3-5 internal structure, the price relationship between waves A, B, and C creates three distinct variations. Identifying these correctly is essential for determining whether the market is merely resting or preparing for a volatile shakeout. In a regular flat, Wave B retraces nearly the entire length of Wave A, ending near its starting point. Wave C then travels back to terminate just slightly beyond the end of Wave A. This variation suggests a market in relative equilibrium, where neither buyers nor sellers have gained a significant upper hand during the corrective phase.
The expanded flat is the most frequent variation and requires the most caution. In this scenario, Wave B moves beyond the start of Wave A, creating a deceptive new price extreme. This is followed by a Wave C that also exceeds the end of Wave A. Finally, the running flat is a rare signal of extreme trend strength. Like the expanded version, Wave B exceeds the start of Wave A, but the subsequent Wave C is so shallow that it fails to reach the end of Wave A. You can track these developing patterns in real-time through our FX Service, where we identify these variations as they form on live charts.
The expanded flat is often referred to as a “trader trap” because Wave B frequently triggers stop-losses by breaking previous highs or lows. Many traders mistake this break for a trend resumption and enter positions in the wrong direction. The key to avoiding this trap is identifying the 3-wave internal structure of Wave B; if the move that breaks the high isn’t impulsive, it’s likely part of an Elliott Wave flat correction. This psychological shakeout clears liquidity on both sides of the range before a powerful Wave C reversal begins, often leaving retail participants on the wrong side of the eventual move.
A running flat suggests that the primary trend is so dominant that the market cannot even sustain a full sideways correction. It’s often difficult to differentiate a running flat from the start of a new impulsive sequence, such as a wave 1-2. However, the internal 3-3-5 count provides the necessary evidence to stay with the existing trend count. Running flats are considered bullish in uptrends and bearish in downtrends because the shallow Wave C demonstrates that market participants are eager to resume the primary direction. When you spot this pattern, it typically precedes an explosive move as the broader trend regains its footing.
Moving from theoretical knowledge to live chart application requires a systematic approach. To identify an Elliott Wave flat correction as it develops, you must look for specific structural clues that separate it from other sideways movements. This process ensures you aren’t guessing at a count but rather following a logical chain of evidence. Use these five steps to validate the pattern before committing capital.
Verifying the internal structure often requires zooming into lower timeframes to see the market fractals more clearly. A common mistake among developing traders is mislabeling a five-wave Wave A as a flat. If the first leg of the correction is impulsive, you’re actually looking at a zigzag, not a flat. You can also use momentum oscillators like RSI or MACD to support your count. These tools often show a clear divergence during the final stages of Wave C, suggesting that the corrective pressure is exhausting and a trend resumption is near.
Every Elliott Wave flat correction has a point where the count is proven wrong. If Wave B exceeds 138% of Wave A, the probability of a flat decreases significantly, and you should reconsider the count. For final confirmation, wait for a trendline break across the internal peaks of the correction. This price action validates that the sideways phase has ended. Wave C is the most tradable part of the pattern because its impulsive nature provides the clearest structure and most predictable targets for entry.
Trading the Elliott Wave flat correction effectively depends on your ability to project completion zones using Fibonacci extensions. Wave C is the most reliable leg for execution because it is a motive move that frequently follows predictable mathematical relationships with Wave A. In a regular flat, the most common outcome is the “Equal Waves” strategy, where Wave C travels exactly 100% of the distance of Wave A. However, the market often extends beyond this level. This makes the 123.6% and 161.8% extensions critical levels to monitor for potential reversals.
Your entry technique should align with your specific risk tolerance. An aggressive approach involves placing limit orders near the 1.236 extension, anticipating the turn before it happens. A more conservative method waits for a break of the Wave B origin or a clear five-wave start to the next impulsive move. Stop-loss placement is straightforward but non-negotiable. In a bull flat, your stop belongs below the low of Wave B; in a bear flat, it sits above the high of Wave B. This placement ensures you are protected if the pattern evolves into a more complex double correction.
Expanded flats offer some of the most lucrative risk-reward setups because of their extreme price extensions. Typically, Wave B will terminate between the 1.236 and 1.382 extension of Wave A. Once this “trap” is set, Wave C often accelerates toward the 1.618 or even the 2.618 extension. By identifying these clusters where multiple Fibonacci levels align, you can find high-probability reversal zones that retail participants often miss. These zones represent the exhaustion of the correction and the likely resumption of the larger trend.
Corrective markets are inherently choppier than impulsive ones. Because of this, it is prudent to use smaller position sizes when trading within an Elliott Wave flat correction compared to a clear wave three impulse. Your profit targets should be set based on the expected length of the next impulsive wave, aiming for a move that exceeds the origin of the flat. You can see these targets applied to current price action in our latest EUR/USD Elliott Wave analysis. To simplify these projections, you can use our Elliott Wave Calculator to quickly generate precise Fibonacci targets for any A-B-C structure.
Since 2003, we’ve provided expert analysis that helps traders move beyond static textbook examples. Reading a book is a necessary first step, but it rarely prepares you for the messy reality of live markets. Static diagrams often fail to capture the ambiguity of a developing Elliott Wave flat correction. At Wavetraders, we provide daily updates that show you how these patterns evolve in real-time across FX, Crypto, and Commodities. Seeing a professional analyst navigate the “trader traps” of an expanded flat as they occur is far more valuable than studying a historical chart.
Our Elliott Wave School is designed to bridge the gap between theory and execution. Students learn to spot the subtle signatures of sideways corrections before they complete. It’s not just about identifying a pattern; it’s about understanding the context of the move within the broader market cycle. By tracking complex Elliott Wave zigzag patterns and flats alongside experts, you develop the pattern recognition skills needed to stay on the right side of the trend. This collaborative environment ensures that you’re never counting in a vacuum.
Members gain access to our proprietary tools that simplify the technical heavy lifting. Many of our practitioners use the Elliott Wave calculator to pinpoint precise targets for Wave C with mathematical objectivity. This removes the guesswork often associated with Fibonacci extensions. For visual learners, our video lessons break down complex counts into digestible steps. These sessions allow you to see the logic behind every wave label. This comprehensive approach helps you transition from a wave counter who gets lost in the sub-waves to a consistently profitable trader who understands high-probability setups.
Membership offers more than just analysis; it provides a shared pursuit of market mastery. You’ll receive daily charts, access to live webinars, and an extensive educational archive that covers every aspect of the methodology. Our analysts provide a calm, measured perspective that helps you ignore market noise and focus on structure. Whether you’re interested in our FX Service or our specialized Digital Currency Service, you’ll find a community dedicated to precise counting and disciplined trading. Apply for your Wavetraders membership today to start tracking the markets with quiet confidence.
We have explored the internal 3-3-5 signature and the critical Fibonacci extensions that define the Elliott Wave flat correction. By distinguishing between regular, expanded, and running variations, you can avoid common traps and identify high-probability entry points with greater precision. This methodical approach transforms sideways price action from a source of frustration into a clear structural roadmap for the next impulsive move.
Mastering these patterns requires more than just theory; it demands consistent practice and exposure to live market conditions. Since 2003, Wavetraders has provided expert analysis and real-time charts for FX, Crypto, and Commodities to help traders refine their counts. Whether you’re looking to join a funded trader program or simply improve your personal execution, professional mentorship can significantly shorten your learning curve and build your technical confidence. Our community is designed to support you as you transition from learning the rules to executing them with discipline.
Master Elliott Wave counting with the Wavetraders School and start tracking the markets alongside a community of experienced practitioners. With the right tools and a patient, observational approach, you can turn market uncertainty into a repeatable trading advantage. We look forward to tracking the next wave with you.
An expanded flat features a Wave B that exceeds the start of Wave A and a Wave C that exceeds the end of Wave A. In contrast, a running flat also has a Wave B that exceeds the start of A, but the subsequent Wave C is shallow and fails to reach the end of Wave A. This indicates extreme trend strength, as the market cannot sustain a full sideways correction before resuming the primary move.
Flat corrections can occur in both positions, though they are statistically more common in Wave 4. According to the guideline of alternation, if Wave 2 was a sharp zigzag, Wave 4 is likely to be a sideways pattern like a flat. While Wave 2 is often deep, a flat correction in this position suggests the underlying trend is exceptionally strong and is only pausing briefly before accelerating into the third wave.
The primary distinction lies in the sub-wave structure and the slope of the boundaries. A flat consists of three waves (3-3-5), whereas a triangle is composed of five waves (3-3-3-3-3) labeled A-B-C-D-E. Additionally, triangles typically feature converging or diverging trendlines that create a wedge shape. An Elliott Wave flat correction moves mostly sideways between horizontal levels, lacking the contracting range that characterizes most triangle patterns.
The 3-3-5 structure describes the internal sub-wave count of a flat correction. Wave A is a corrective three-wave move, followed by another three-wave move in Wave B. The final leg, Wave C, is a motive five-wave sequence. This transition from corrective to motive internal waves is what makes the final leg of a flat so powerful and predictable for traders who correctly identify the pattern’s early stages.
It earns this name because Wave B moves beyond the origin of Wave A, tricking breakout traders into believing the primary trend has already resumed. These participants often enter just as Wave B exhausts, only to be caught in the sharp reversal of Wave C. The pattern effectively clears stop-losses above and below the range before the true trend resumption occurs, leaving retail traders on the wrong side of the move.
Flats generally take more time to complete than zigzags because they are sideways “time” corrections. While a zigzag is a sharp, aggressive price retracement that often ends quickly, a flat grinds sideways through overlapping waves. This extended duration helps neutralize sentiment and reset momentum oscillators. Traders should exercise more patience when they suspect an Elliott Wave flat correction is forming, as the pattern requires more development to reach its completion zones.
Wave C is often considered the most tradable part of the entire corrective structure. Because it is a motive five-wave move, it possesses the same directional clarity as a standard impulse wave. Once Wave B validates the 90% retracement rule, traders can project the length of Wave C with high accuracy. However, it’s essential to manage risk carefully, as the volatility at the end of a correction can be high.
The most critical levels are the 90% retracement for Wave B validation and the 100%, 123.6%, and 161.8% extensions for Wave C targets. In expanded variations, Wave B often reaches the 1.236 or 1.382 extension of Wave A. Using these levels in combination with internal wave counting allows for precise entry and exit points. Our Elliott Wave calculator helps members quickly identify these specific price clusters on live charts.
DISCLAIMER
Any reviews, news, analysis, prices or other information contained on our website is provided as general market commentary and delivered electronically through a distribution channel to larger number of clients, therefore does not constitute investment advice or investment research. We are not trading advisors. Most of our work is for educational purposes only, with information based on Elliott Wave theory in real time. Trading forex, futures, options, stocks, cryptocurrenices or any another trading market carries a high level of risk, and may not be suitable for all investors.
The possibility exists that you could lose some or all of your initial investment; therefore you should not invest money that you cannot afford to lose. Our website and the information that we provide should not be relied upon as a substitute for extensive independent research before making your investment decisions. In no event will we be liable for any loss or damage on your account in connection with, the use of our products. For any real cash investments you have to contact your financial advisor.
Any information or material contained on our website is owned by Val Global d.o.o.. Reproduction is prohibited without Val Global d.o.o. prior license in writing.
By continuing to use the site, you agree to the use of cookies. Learn more.
The cookie settings on this website are set to "allow cookies" to give you the best browsing experience possible. If you continue to use this website without changing your cookie settings or you click "Accept" below then you are consenting to this.