The most successful traders don’t see the market as a chaotic series of random price ticks; they recognize that every major trend is actually a mathematical map of human emotion. It’s often frustrating when your wave counts feel subjective or when a 1930s theory feels out of step with the high-velocity markets of August 2026. You’ve likely experienced the difficulty of distinguishing between a complex corrective move and a true motive trend, especially when price action is moving as fast as it does today.
By mastering the elliott wave theory of financial markets 1235 wave cycle, you can move past the guesswork and start forecasting price action with professional precision. We’ll provide a clear mental framework for the five-wave cycle, explaining the specific psychology that drives each stage from initial doubt to final euphoria. You’ll learn how to spot a surging Wave 3 in real-time, much like the 161.8% extension we recently tracked in Bitcoin, and understand how to apply these timeless principles to modern assets like the S&P 500 and the DAX.
At its core, the Elliott Wave Principle is the study of repetitive patterns in price action driven by the collective psychology of market participants. It suggests that markets don’t move in straight lines; they move in waves. These waves reflect the natural ebb and flow of human sentiment, swinging from deep pessimism to peak optimism. Mastering the elliott wave theory of financial markets 1235 wave cycle allows a trader to see the underlying structure of a trend rather than just random price fluctuations.
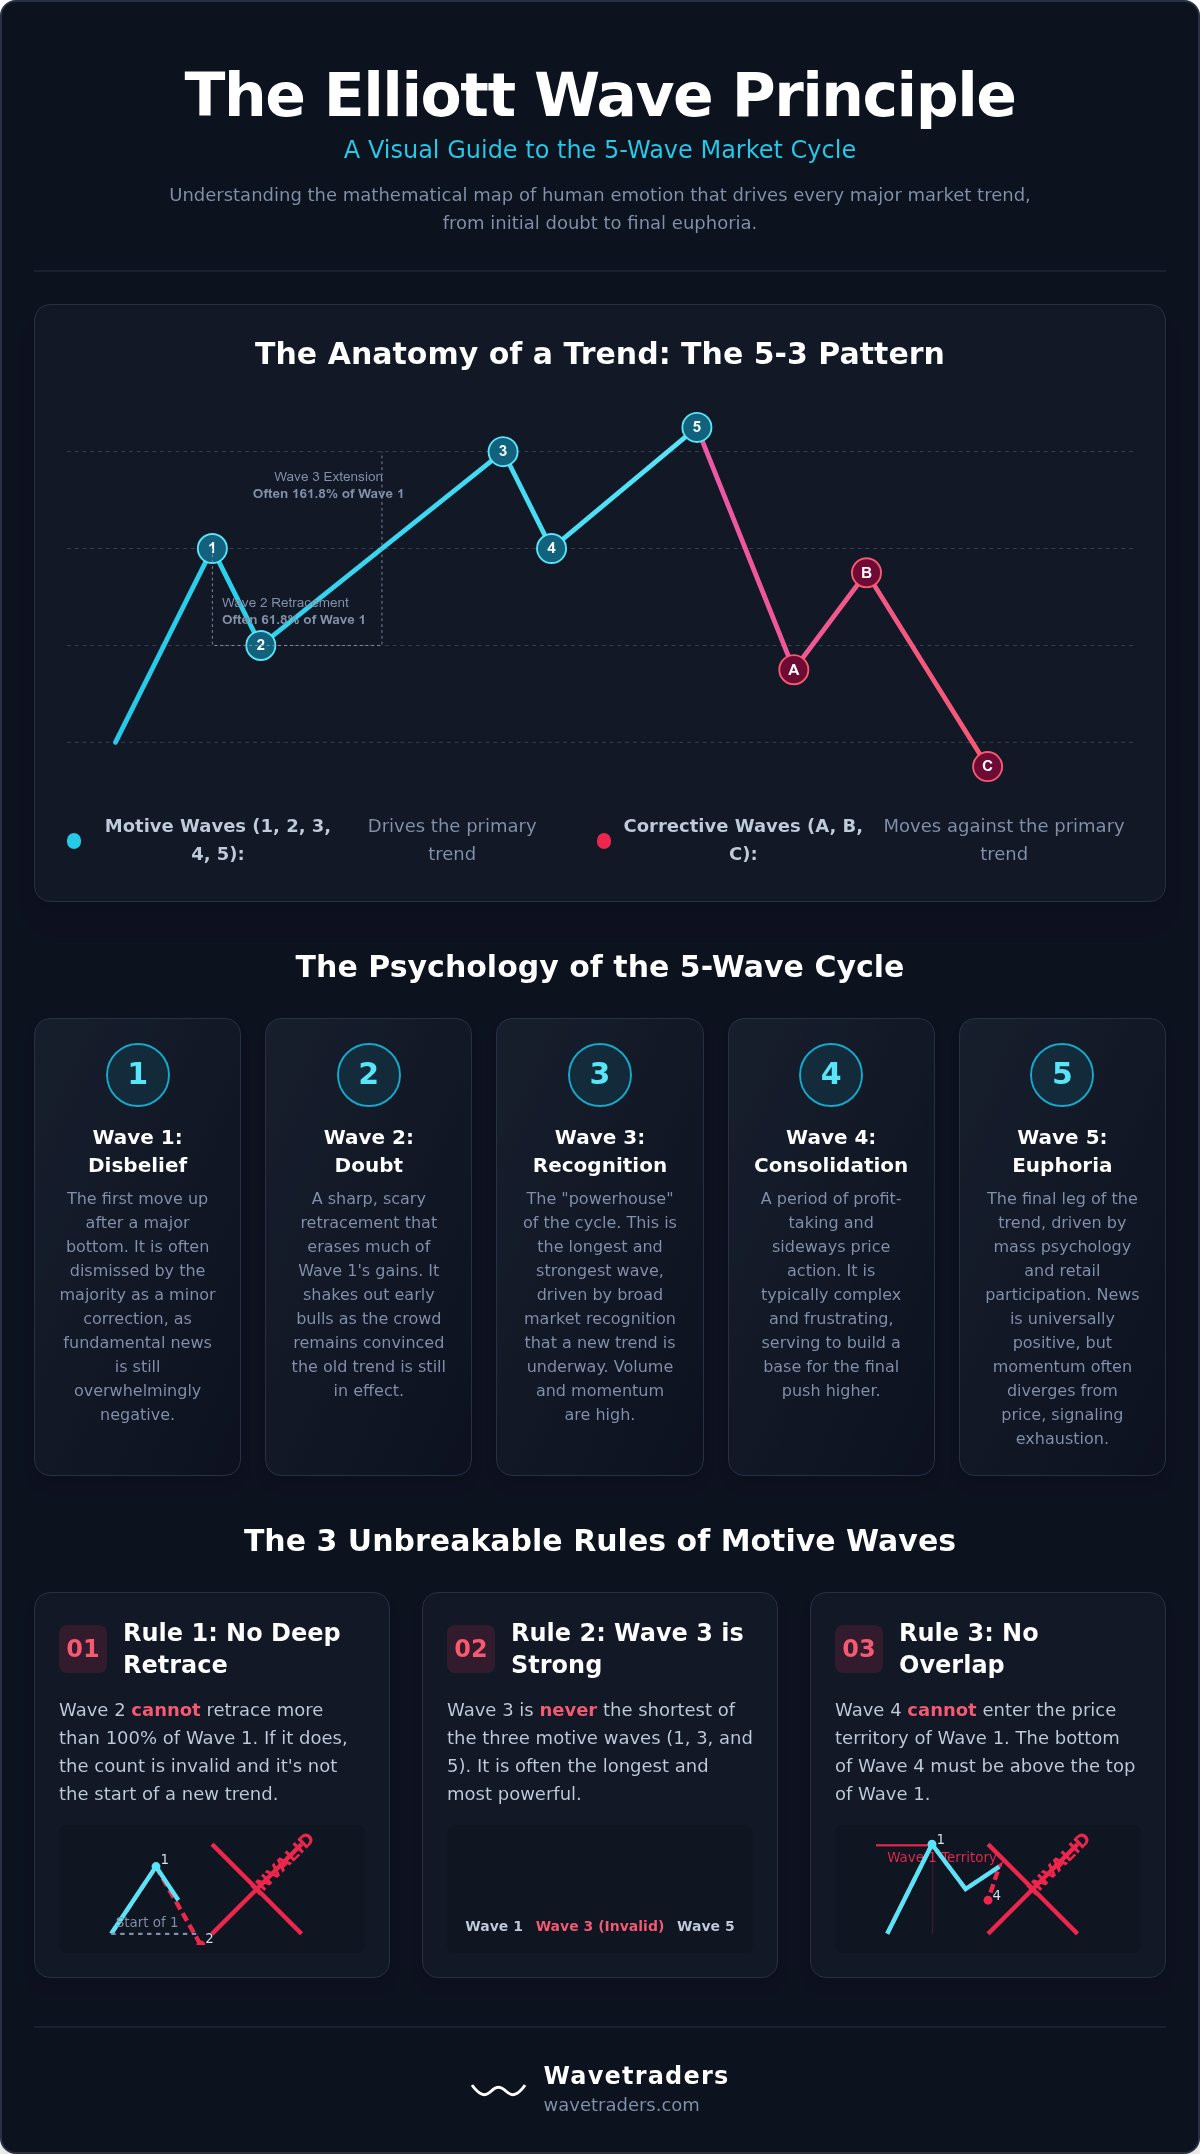
In a trending market, the primary movement takes the form of a five-wave motive sequence. Waves 1, 3, and 5 are the impulsive legs that drive the market forward. Waves 2 and 4 are the corrective phases where the market pauses or retraces. Traders often use the elliott wave theory of financial markets 1235 wave cycle shorthand to focus on these specific turning points, as they represent the critical milestones of a maturing trend. Identifying these stages helps you anticipate where the market is likely to go next with a higher degree of probability.
Markets are fractal. This means that a five-wave cycle on a daily chart is actually built from smaller five-wave cycles visible on an hourly or fifteen-minute chart. It’s a system of waves within waves. This nesting of patterns is what gives the theory its power across different trading styles. To keep track of these nested cycles, we use wave degrees. These range from the massive Grand Supercycle, which spans decades, down to the Subminuette, which might complete in a matter of hours. Understanding this hierarchy is essential for maintaining context in your analysis.
The strength of this theory lies in its objectivity. For a five-wave motive count to be considered valid, it must follow three specific rules. If price action breaks any of these, your count is wrong and you must look for an alternative interpretation.
By applying these rules, you can filter out false signals and stay aligned with the true market direction. While the theory is simple in concept, applying it consistently takes practice and a disciplined approach to chart analysis.
To become a consistently profitable trader, you must shift your focus from abstract lines on a chart to the underlying human emotions of the crowd. The elliott wave theory of financial markets 1235 wave cycle isn’t just a technical pattern; it’s a visual representation of how sentiment shifts from extreme fear to unbridled greed. By understanding the psychology behind each wave, you can anticipate market turns with a level of quiet confidence that eludes most retail participants. This mental framework allows you to remain a detached observer of the crowd’s behavior.
Wave 1 represents the initial reversal. It’s born out of a period of intense selling or stagnation, meaning most participants dismiss it as a “dead cat bounce” or a minor correction within the old trend. Because the news cycle is still negative, the majority of traders miss this first move. Then comes Wave 2, a sharp and often scary retracement that tests the resolve of early bulls. This phase frequently pulls back to deep Fibonacci levels, such as the 61.8% or 78.6% retracements, as the crowd remains unconvinced that a new trend has truly begun. It’s the final shakeout before the real move starts.
Wave 3 is the powerhouse of the cycle where the most money is made. This is the recognition phase, the moment when the broader market finally accepts that the trend has changed. You’ll observe high volume, surging momentum, and very shallow pullbacks. It’s typically the longest and most reliable part of the sequence. Our Cardano Elliott Wave analysis frequently highlights these explosive third waves, showing how they can extend far beyond initial expectations once institutional volume kicks in. This is where the consensus becomes bullish and the trend becomes undeniable.
Wave 4 is typically a complex, sideways correction that makes it feel like the trend is over. It’s designed to frustrate traders and create doubt, often taking the form of a triangle or a flat pattern. Wave 5 is the phase where retail FOMO typically peaks while professionals exit. This final rally is driven by laggards and glowing news headlines, often creating a blow-off top that lacks the internal strength of Wave 3. You should watch for warning signs like an ending diagonal or clear momentum divergence, which suggest the trend is nearing exhaustion. Reframing the market as a psychological cycle allows you to stay calm when the rest of the market is reaching a fever pitch. If you find these counts difficult to distinguish in real-time, our Elliott Wave School provides the tools to build a more objective analytical framework.
Every market trend operates on a fundamental “5-3” rhythm. Once the initial five-wave motive sequence completes, the market naturally shifts into a three-wave corrective phase, typically labeled as A-B-C. This eight-wave structure represents a complete cycle in the elliott wave theory of financial markets 1235 wave cycle. Recognizing where you are in this sequence is the difference between catching a breakout and buying a local top.
Motive waves are the primary drivers of price. They move with the dominant trend, covering significant distance with high momentum. In contrast, corrective waves move against that trend; they are often slower, more complex, and harder to trade. A key concept to remember is the guideline of alternation. If Wave 2 was a sharp, deep retracement, Wave 4 will likely be a shallow, sideways consolidation. This helps you anticipate the “look” of the next wave before it actually happens.
| Feature | Motive (Impulse) | Corrective |
|---|---|---|
| Direction | With the main trend | Against the main trend |
| Wave Count | 5 Waves (1-2-3-4-5) | 3 Waves (A-B-C) |
| Typical Sentiment | Growing conviction and momentum | Indecision and profit-taking |
While motive waves follow a strict five-wave path, corrections can take several forms. Identifying these patterns early allows you to prepare for the start of the next 1235 cycle. The most common structures include:
Spotting when a 5-wave move is complete is a core skill for any analyst. By identifying the internal sub-waves of Wave 5 and watching for momentum exhaustion, you can predict when a correction is imminent. Our altcoin Elliott Wave analysis frequently uses these structural signals to identify local tops in the volatile digital asset markets, helping traders avoid the trap of buying at the peak of exhaustion.
Applying the elliott wave theory of financial markets 1235 wave cycle to a fresh chart requires a methodical approach that balances pattern recognition with mathematical confirmation. In the fast-moving markets of 2026, relying on intuition alone often leads to subjective errors. Instead, professional analysts use a repeatable workflow to validate their counts before committing capital. This measured pace of analysis ensures you aren’t chasing price, but rather waiting for the market to meet your pre-defined structural requirements.
One of the most effective ways to confirm a cycle is through the use of momentum oscillators like the Relative Strength Index (RSI). During a healthy impulse, Wave 3 should display the strongest momentum readings, often staying in overbought territory for extended periods. When you see price making new highs in Wave 5 but the RSI failing to follow suit, it’s a clear sign of exhaustion and an imminent reversal. To set price targets, we turn to Fibonacci extensions. The “Golden Ratio” (1.618) is the primary target for an extended Wave 3, acting as a mathematical magnet for trending markets.
The personality of these cycles changes depending on the asset class you’re tracking. In our Solana Elliott Wave analysis, we often see cycles accelerate with extreme volatility, where Wave 3 extensions can reach the 2.618 or even 3.618 levels quite rapidly. Conversely, EUR/USD Elliott Wave analysis tends to be much choppier, with deeper Wave 2 and Wave 4 pullbacks compared to equities. Because these calculations can become complex when tracking multiple timeframes, many of our members use the Elliott Wave Calculator to automate their projections and maintain objectivity in their analysis. This tool helps remove the emotional burden of manual calculation, allowing you to focus on the broader market context.
Moving from theory to professional application involves more than just memorizing rules. It requires an understanding of how these patterns manifest in different market environments. A professional analyst doesn’t just look for a five-wave move; they look for the synergy between price, momentum, and Fibonacci levels. This holistic view helps reduce the subjectivity that often causes beginners to feel overwhelmed by the methodology.
Textbooks often present “perfect” wave patterns that rarely appear exactly the same way in the wild. A mentor or structured environment helps you navigate the messiness of real-time price action, particularly when dealing with complex “W-X-Y” corrections. These double or triple threes can be incredibly frustrating for self-taught traders who only recognize simple zigzags. If you want to move beyond the basics, taking a dedicated wave theory trading course is often the most efficient way to shorten your learning curve. Our Elliott Wave School provides this structured path, moving you from foundational rules to advanced application and helping you avoid the common pitfall of “forced counts.”
Learning in a vacuum is difficult. Professional analysis services provide a crucial “second opinion” that helps build your confidence when the market becomes volatile. At Wavetraders, we don’t just give you static counts; we show the theory in action using current 2026 market data across FX, crypto, and commodities. This practitioner-led approach ensures you see how the elliott wave theory of financial markets 1235 wave cycle adapts to modern liquidity and high-frequency environments.
This collaborative environment ensures you aren’t just memorizing labels but are actually learning to read the market’s language. Success in the markets isn’t about being right every single time. It’s about having a reliable framework to manage uncertainty and identify high-probability opportunities. We invite you to join the Wavetraders community and start tracking these cycles together.
Mastering the elliott wave theory of financial markets 1235 wave cycle is about more than just identifying patterns; it’s about gaining a deep understanding of the psychological forces that drive price action. We’ve explored how the transition from disbelief to euphoria creates a predictable five-wave structure that you can use to forecast trends with professional precision. By distinguishing between motive impulses and corrective pauses, you can stay aligned with the broader market direction while avoiding the traps of retail FOMO. This structural clarity is what separates a consistent practitioner from a frustrated amateur.
Transitioning from a basic understanding to consistent application takes time and a disciplined approach. With over 20 years of market analysis experience, Wavetraders provides the structured environment you need to build this expertise. Members gain access to real-time video updates on FX and Crypto, along with our comprehensive Elliott Wave Calculator to simplify Fibonacci projections. You don’t have to navigate these complex cycles alone. Master the markets with the Wavetraders Elliott Wave School and join a community dedicated to professional-grade analysis. We look forward to tracking the cycles with you.
It’s the core motive sequence of the Elliott Wave Principle, consisting of three trend-aligned advances and two corrective pullbacks. This pattern represents the natural progression of market sentiment from initial reversal to peak euphoria. By mastering the elliott wave theory of financial markets 1235 wave cycle, you can identify the primary direction of any asset. It provides a structural map for the most profitable legs of a trend.
Yes, because market patterns are fractal and appear on all timeframes. You can identify a five-wave motive cycle on a 1-minute or 5-minute chart just as clearly as on a daily chart. However, lower timeframes often contain more noise, requiring faster execution and tighter risk management. Most professional practitioners use intraday wave counts to fine-tune entries within a larger, higher-degree trend. It helps you stay aligned with immediate momentum.
Wave 3 is characterized by strong momentum, high volume, and shallow pullbacks. If the price action is explosive and easily breaks the peak of Wave 1, it’s likely a third wave. Corrective bounces tend to be choppy, overlapping, and lack the sustained power of an impulse. You can use momentum oscillators like RSI to confirm strength; Wave 3 typically reaches the highest momentum reading of the entire five-wave sequence.
Absolutely, because algorithms are programmed by humans and respond to the same liquidity zones and psychological levels. Even in 2026, market participants react to fear and greed in repetitive ways. Algorithms often exacerbate these wave patterns by triggering stops or entering at key Fibonacci confluence zones. The elliott wave theory of financial markets 1235 wave cycle remains a reliable way to track the footprint of institutional money, regardless of execution speed.
If a cardinal rule is broken, your current count is invalid and you must re-analyze the chart. For instance, if Wave 4 enters the price territory of Wave 1, you aren’t looking at a standard impulse. You might be seeing a diagonal pattern or a more complex corrective structure. This objectivity is the theory’s greatest strength. It forces you to discard biased views and look for a count that fits the market’s actual behavior.
The most critical levels are the 61.8% retracement for Wave 2 and the 161.8% extension for Wave 3. Wave 4 typically pulls back to the 38.2% level of the preceding third wave. These ratios act as high-probability zones where the crowd’s sentiment often shifts. Using the Wavetraders Elliott Wave Calculator can help you quickly identify these targets without manual errors, ensuring your analysis remains consistent across different instruments and timeframes.
You don’t need expensive proprietary software to identify these patterns. Standard charting platforms are sufficient as long as they include basic drawing tools and Fibonacci levels. The most important software is your own ability to recognize structures objectively. While automated scanners can help find potential setups, the final count should always be verified by a human practitioner who understands the broader context and current market environment.
Learning the basic rules takes a few days, but mastering the application typically requires several months of consistent practice. Most traders find that their accuracy improves significantly once they move past textbook examples and start analyzing live 2026 markets. A structured path, like our Elliott Wave School, shortens this curve by providing real-time feedback and expert guidance. It’s a journey from understanding simple labels to developing a seasoned feel for market rhythm.
DISCLAIMER
Any reviews, news, analysis, prices or other information contained on our website is provided as general market commentary and delivered electronically through a distribution channel to larger number of clients, therefore does not constitute investment advice or investment research. We are not trading advisors. Most of our work is for educational purposes only, with information based on Elliott Wave theory in real time. Trading forex, futures, options, stocks, cryptocurrenices or any another trading market carries a high level of risk, and may not be suitable for all investors.
The possibility exists that you could lose some or all of your initial investment; therefore you should not invest money that you cannot afford to lose. Our website and the information that we provide should not be relied upon as a substitute for extensive independent research before making your investment decisions. In no event will we be liable for any loss or damage on your account in connection with, the use of our products. For any real cash investments you have to contact your financial advisor.
Any information or material contained on our website is owned by Val Global d.o.o.. Reproduction is prohibited without Val Global d.o.o. prior license in writing.
By continuing to use the site, you agree to the use of cookies. Learn more.
The cookie settings on this website are set to "allow cookies" to give you the best browsing experience possible. If you continue to use this website without changing your cookie settings or you click "Accept" below then you are consenting to this.