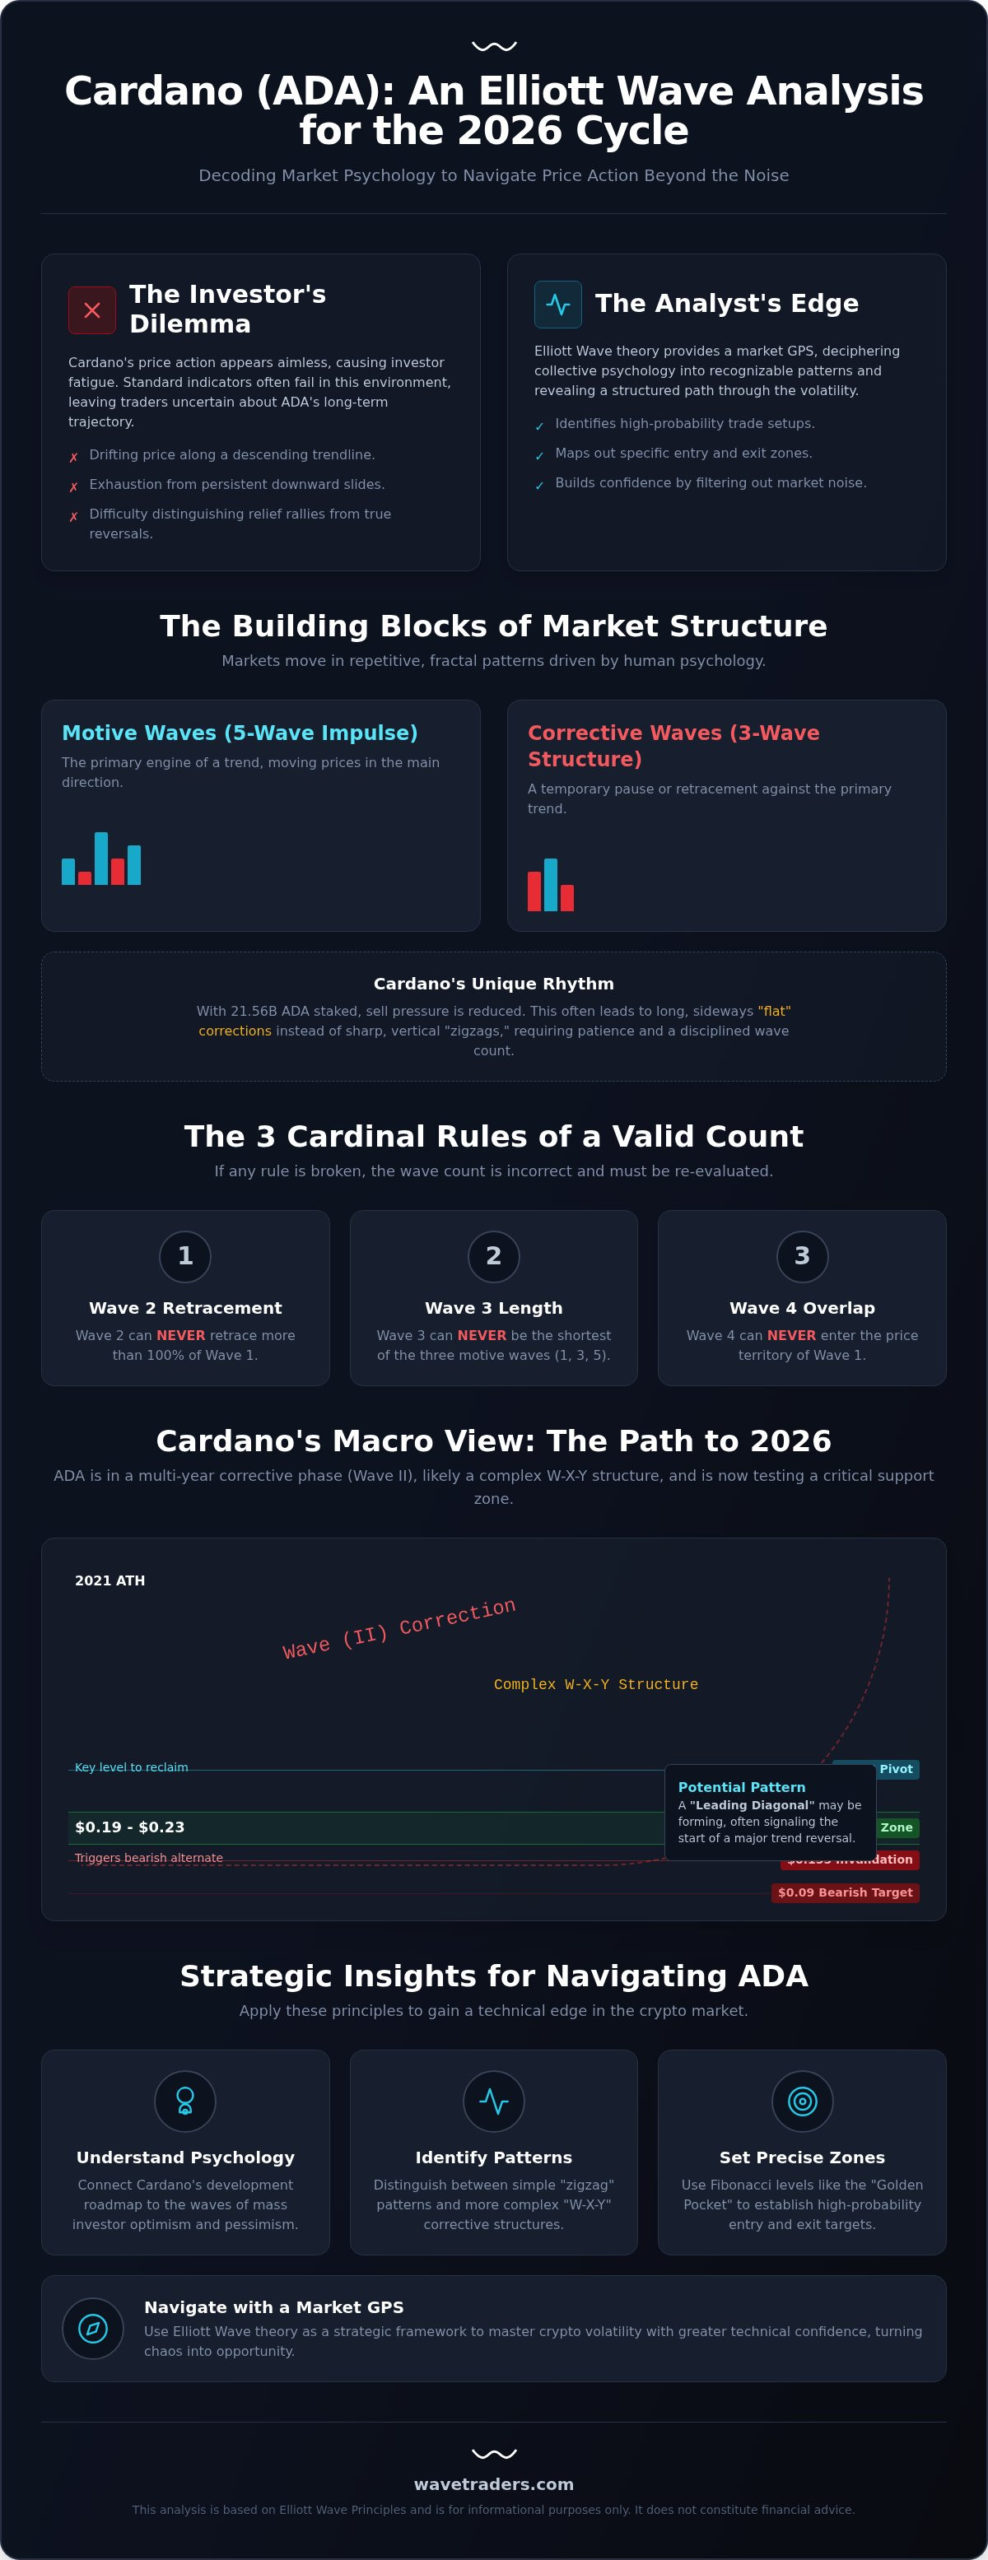
The most dangerous time to trade an asset is when it appears to be drifting aimlessly, yet for those who understand market structure, Cardano’s current price action is anything but random. While many investors feel exhausted by the persistent slide along a descending trendline toward the $0.19 level, a disciplined Cardano Elliott Wave analysis reveals that this volatility is part of a larger, necessary corrective phase. It’s understandable if you’re struggling to tell the difference between a temporary relief rally and a genuine trend reversal. Standard indicators often fail in these environments, leaving you with more questions than answers about ADA’s long term trajectory.
We’ve spent years tracking these cycles to help traders find clarity when the broader market feels chaotic. In this guide, we’ll show you how Elliott Wave theory deciphers Cardano’s complex price action to identify high-probability trade setups throughout 2026. You’ll gain a clear perspective on the current wave count, including why the support zone between $0.19 and $0.23 is so critical for the next move. We’ll map out the specific patterns currently forming, provide defined entry and exit zones, and help you build confidence in the 2026 market cycle.
The Elliott Wave Principle operates on the premise that market prices aren’t driven by news or earnings alone, but by the collective psychology of the participants. These patterns of optimism and pessimism repeat in recognizable waves. In the context of Cardano, these signatures are particularly distinct. Because the project follows a peer-reviewed, academic development path, the price action often lacks the erratic spikes seen in speculative assets. Instead, it moves with a more deliberate, structural rhythm. A professional Cardano Elliott Wave analysis identifies two primary types of movement: motive waves and corrective waves. Motive waves move the price in the direction of the primary trend and consist of five sub-waves. Corrective waves, which typically consist of three sub-waves, act as a temporary pause or retracement of that trend.
These patterns are fractal. This means the same five-wave impulse you see on a weekly chart is also building itself out on a 15-minute timeframe. This repetition allows traders to identify where they are in the larger cycle by observing smaller, developing patterns. Understanding this hierarchy is essential for timing entries and exits without getting lost in the daily noise of the market.
Cardano holders are famously patient. With 21.56 billion ADA staked across nearly 3,000 pools as of August 2026, a significant portion of the supply is locked away from immediate sell pressure. This high staking ratio often prevents the sharp, vertical “zigzags” common in other altcoins. Instead, ADA frequently develops “flat” corrections, where the price moves sideways as the market digests previous gains. Major ecosystem updates often serve as the fundamental catalyst that triggers a powerful Wave 3 extension. For example, the recent integration of the Midnight sidechain into the Confidential Computing Consortium provides the kind of technical validation that shifts sentiment from caution to bullishness, driving the next phase of the Cardano Elliott Wave analysis count.
To maintain an accurate count, you must adhere to three unbreakable rules. If any of these are violated, your interpretation of the market is incorrect and must be relabeled. This discipline is what separates professional analysis from guesswork.
By following these guidelines, you can filter out the noise and focus on high-probability setups. When the price respects these boundaries, it confirms the strength of the current trend.
The macro chart for Cardano shows a significant corrective structure that’s been in play since the 2021 all-time high. This multi-year decline represents a Wave (II) pullback. While a simple zigzag is often the initial interpretation, the length and complexity of the price action suggest a complex W-X-Y structure is more likely. As of August 2026, ADA is testing a vital support zone between $0.19 and $0.23. This area is crucial. Historically, the $0.38 level has served as a major support and resistance pivot. Reclaiming that level would be a strong signal that the bearish trend is losing its grip. Our current Cardano Elliott Wave analysis focuses on whether the recent slide along the descending trendline is the final exhaustion of this multi-year correction.
Cardano’s recent structure is distinct when compared to its peers. Our Solana Elliott Wave analysis mapping the path to the 2026 cycle peak showed a much more aggressive recovery. In contrast, ADA looks to be forming a leading diagonal. This is a five-wave motive structure where waves 1 and 4 overlap, often signaling the start of a major trend change. While our primary count is bullish, we’re watching the $0.155 support level closely. If that fails, a bearish alternate count could see prices test lower targets around $0.09. We’re currently analyzing the internal sub-waves of the 2026 price action to see if a five-wave impulse is beginning to emerge from these lows.
Cardano doesn’t trade in a vacuum. Bitcoin’s momentum heavily influences the broader market, but ADA often shows unique periods of decoupling. These events usually happen when ADA is completing a specific internal wave count that doesn’t align perfectly with BTC’s timing. To validate our Cardano Elliott Wave analysis, we look for confluence in the Total3 index. This index tracks the altcoin market cap and helps confirm if the entire sector is ready for a reversal. Tracking these correlations helps us distinguish between a dead-cat bounce and a sustainable move. Understanding the broader sector context is essential, which is why our comprehensive altcoin Elliott Wave analysis mapping the 2026 crypto market cycles provides the wider framework needed to see how ADA fits within the larger digital asset landscape. You can see how we track these nuances in real-time through our Digital Currency Service. By observing how ADA reacts when the Total3 index hits key Fibonacci levels, we can better predict when the next major leg up will begin.
While standard Cardano Elliott Wave analysis provides a solid foundation, Neowave offers a more rigorous framework for those seeking deeper precision. Developed by Glenn Neely, this methodology introduces strict requirements for time and complexity that standard theory often overlooks. One of the first adjustments we make when applying Neowave to ADA is the use of logarithmic scaling. For an asset that has moved from pennies to dollars, linear charts mask the true proportional relationships between waves. On a log chart, a 50% move looks the same regardless of the price level, which is essential for identifying valid corrective structures in a multi-year cycle.
Traditional Elliott Wave often relies on the visual “shape” of a pattern. This can lead to subjective counts and frequent re-labeling. Neowave shifts the focus toward the internal logic and time duration of the price action. For a structured asset like Cardano, complexity is a feature, not a bug. Neowave introduces “Power Ratings” to waves, which helps us predict the magnitude of the move that follows a completed pattern. If a pattern has a high power rating, we can expect a more explosive breakout. This approach is superior for filtering out the “false” wave counts that frequently trap retail traders during a standard Cardano Elliott Wave analysis when prices are range-bound.
Neowave also emphasizes time as much as price. By calculating the duration of the current corrective phase that began in 2021, we can project the likely window for the next major peak. Cardano’s price history is full of neutral triangles and diametric formations. These are complex seven-legged patterns that standard theory often mislabels as simple ABC corrections. Currently, we’re watching for a “non-limiting” triangle in the 2026 data. Unlike their limiting counterparts, non-limiting triangles don’t require the price to break out immediately at the apex. Instead, they signal a massive, sustained trend that could carry ADA toward its 2026 year-end targets. If you want to learn how to identify these advanced patterns yourself, our Elliott Wave School provides the deep-dive training needed to master these concepts with confidence.
Identifying the pattern is only half the battle. To execute a trade with confidence, you need precise price levels where the probability of a reversal is highest. Fibonacci retracement levels serve as the primary tool for this task. In a standard Cardano Elliott Wave analysis, we look for Wave 2 or Wave B to pull back into a specific range before the next leg begins. The most common retracement levels are 0.382, 0.5, and 0.618. For ADA, the area between the 0.618 and 0.65 levels is often referred to as the “Golden Pocket.” This zone frequently acts as the ultimate reversal point for corrective waves. While shallow corrections might only hit the 0.382 level, the volatile crypto markets often seek deeper liquidity in the Golden Pocket before continuing the primary trend.
To simplify these calculations, our proprietary Elliott Wave Calculator allows you to input the high and low of a completed Wave 1 to instantly generate these targets. This tool removes the manual guesswork, ensuring your levels are mathematically sound before you commit capital. It’s an essential part of a professional toolkit, especially when dealing with the complex wave signatures found in a detailed Cardano Elliott Wave analysis.
Wait for a clear five-wave impulse move to develop off a major low, such as the key support zone near $0.19 identified in August 2026. This confirms that a new trend is likely starting. Once Wave 1 is complete, measure the move from start to finish. You should look for an entry in the 50% to 61.8% retracement zone. This patient approach prevents you from chasing the initial pump. Always set your stop-losses just below the beginning of Wave 1 or the $0.155 support level. If the price drops below that point, the count is invalidated, and the bearish trend is still in control.
Once you’re in a trade, Fibonacci extensions help you decide when to take profits. The 1.618 extension is the standard target for a powerful Wave 3. If the momentum is particularly strong, Wave 3 can even reach the 2.618 level. However, you must stay alert for a “Truncated Wave 5.” This occurs when the final wave of an impulse fails to move past the peak of Wave 3. It’s often a sign of exhaustion and signals an abrupt trend reversal. Managing these exits effectively requires disciplined Elliott Wave risk management to protect your gains as the cycle matures. Don’t let a winning trade turn into a loss by ignoring these structural warnings.
For those who want to see these levels applied to live charts every day, our Digital Currency Service provides real-time ADA updates and precise wave counts to help you trade with clarity.
Elliott Wave theory acts as a strategic GPS for the financial markets. While many retail traders rely on automated bots that often fail during complex corrective shifts, a practitioner-led approach anticipates these transitions before they occur. By consistently applying Cardano Elliott Wave analysis, you move from reacting to erratic price swings to understanding the structural context of every move. This methodical perspective replaces the emotional stress of trading with a calm, analytical confidence. It’s about recognizing that volatility isn’t random; it’s a reflection of human psychology mapped out in repeatable patterns.
Success in these markets requires more than just a set of rules. It demands a commitment to the craft and a willingness to look past the immediate noise. Whether the market is trending or consolidating, having a professional framework allows you to stay focused on high-probability setups. We believe in sharing this expertise to help you navigate the 2026 cycle with clarity and purpose.
Our Digital Currency Service provides the daily clarity needed to navigate the complexities of the crypto space. Members gain access to daily video updates where we break down Cardano and other major digital assets in real-time. These aren’t just simple price alerts; they are educational sessions that feature live chart examples. You’ll see exactly how we identify the sub-waves and pivots discussed in previous sections, which helps you learn the methodology while you trade. This community environment is invaluable for verifying your own wave counts and ensuring your analysis aligns with professional standards.
Independence is the ultimate goal for any serious market participant. Our Elliott Wave School is designed to move you from a consumer of analysis to a master of the craft. We teach the same rigorous standards we use in our daily work, covering everything from basic impulse rules to the advanced Neowave concepts required for volatile assets. For those who demonstrate consistency and discipline, our Funded Trader Program offers a unique path to scale your Cardano strategy with institutional capital. It’s about building a sustainable trading career through education, practice, and community support. If you’re ready to take the next step in your trading journey, apply for the Digital Currency Service today and start tracking the markets with us.
Markets rarely reward the impatient, but they consistently provide opportunities for those who understand their inner mechanics. Our Cardano Elliott Wave analysis suggests that the multi-year corrective structure is reaching a mature stage as it tests critical support zones. By applying the rules of wave proportionality and Fibonacci targets, you can move beyond the stress of unpredictable price swings and trade with a clear, objective plan. This practitioner-led approach ensures you stay focused on high-probability setups rather than chasing daily market noise.
We’ve spent over 20 years refining our market analysis expertise to provide clarity in these volatile environments. Whether you’re looking for real-time updates on ADA, XRP, and Solana or want to master the methodology yourself through our comprehensive Elliott Wave School curriculum, we’re here to help you navigate these cycles. Join us as we track these developments together to refine our counts and stay ahead of the curve. Start Your Journey with the Wavetraders Digital Currency Service and gain the confidence to trade the 2026 market cycle with professional precision.
The macro outlook is cautiously bullish as ADA navigates a significant multi-year correction. While the price has slid along a descending trendline toward the $0.19 level, this move appears to be the final leg of a complex corrective structure. A detailed Cardano Elliott Wave analysis helps identify the specific sub-waves within this decline. This transition requires patience, as the market structure must complete all internal sub-waves before a sustainable reversal is confirmed.
Impulse waves consist of five sub-waves that move in the direction of the primary trend, while corrections typically have three waves moving against it. You can identify an impulse by its strong momentum and lack of overlap between Wave 1 and Wave 4. In contrast, impulse waves are characterized by their clarity and directional strength, making them easier to trade once the initial pivot is established and confirmed by the market.
Elliott Wave theory identifies high-probability price zones rather than single exact numbers. It provides a structural map of the market based on investor psychology. By using Fibonacci ratios, we can project likely targets for wave completions. However, traders should always acknowledge the inherent uncertainty of market forecasting and use these zones to manage risk rather than expecting absolute precision in every price move.
A comprehensive Cardano Elliott Wave analysis should start with weekly and daily charts to establish the macro trend. Once the larger cycle is clear, you can zoom into 4-hour or 1-hour timeframes to find specific entry points. Because the methodology is fractal, the same patterns appear across all timeframes. However, higher timeframes generally provide more reliable signals for long term direction and help filter out the noise of intraday volatility.
Fibonacci ratios provide the mathematical foundation for measuring wave length and retracement depth. In crypto markets, waves often respect these levels with high frequency. For instance, Wave 2 typically retraces 50% to 61.8% of Wave 1, while Wave 3 often reaches the 1.618 extension. These ratios help confirm whether a specific wave count is valid and identify where the next significant reversal might occur.
Cardano’s high staking ratio and peer-reviewed development cycle contribute to its tendency for complex corrections. A large portion of the circulating supply is held by long term participants, which dampens the sharp volatility often seen in speculative assets. This results in prolonged sideways movements, such as double threes or diametric formations, as the market slowly digests previous gains before starting a new motive phase.
Neowave is a more rigorous extension that is particularly well-suited for the complexity of Cardano’s price action. While standard theory focuses on general shapes, Neowave introduces strict time and complexity requirements that help filter out false counts. For volatile digital assets, this additional layer of discipline often provides a more accurate reflection of the true market structure over long periods of time.
Breaking an invalidation level means the current count is incorrect and must be immediately relabeled. For example, if the price retraces more than 100% of Wave 1, the impulse scenario is void. Professional traders use these levels to exit positions and reassess the market structure. It’s a vital part of risk management that prevents you from holding onto a losing bias when the price data changes.
DISCLAIMER
Any reviews, news, analysis, prices or other information contained on our website is provided as general market commentary and delivered electronically through a distribution channel to larger number of clients, therefore does not constitute investment advice or investment research. We are not trading advisors. Most of our work is for educational purposes only, with information based on Elliott Wave theory in real time. Trading forex, futures, options, stocks, cryptocurrenices or any another trading market carries a high level of risk, and may not be suitable for all investors.
The possibility exists that you could lose some or all of your initial investment; therefore you should not invest money that you cannot afford to lose. Our website and the information that we provide should not be relied upon as a substitute for extensive independent research before making your investment decisions. In no event will we be liable for any loss or damage on your account in connection with, the use of our products. For any real cash investments you have to contact your financial advisor.
Any information or material contained on our website is owned by Val Global d.o.o.. Reproduction is prohibited without Val Global d.o.o. prior license in writing.
By continuing to use the site, you agree to the use of cookies. Learn more.
The cookie settings on this website are set to "allow cookies" to give you the best browsing experience possible. If you continue to use this website without changing your cookie settings or you click "Accept" below then you are consenting to this.