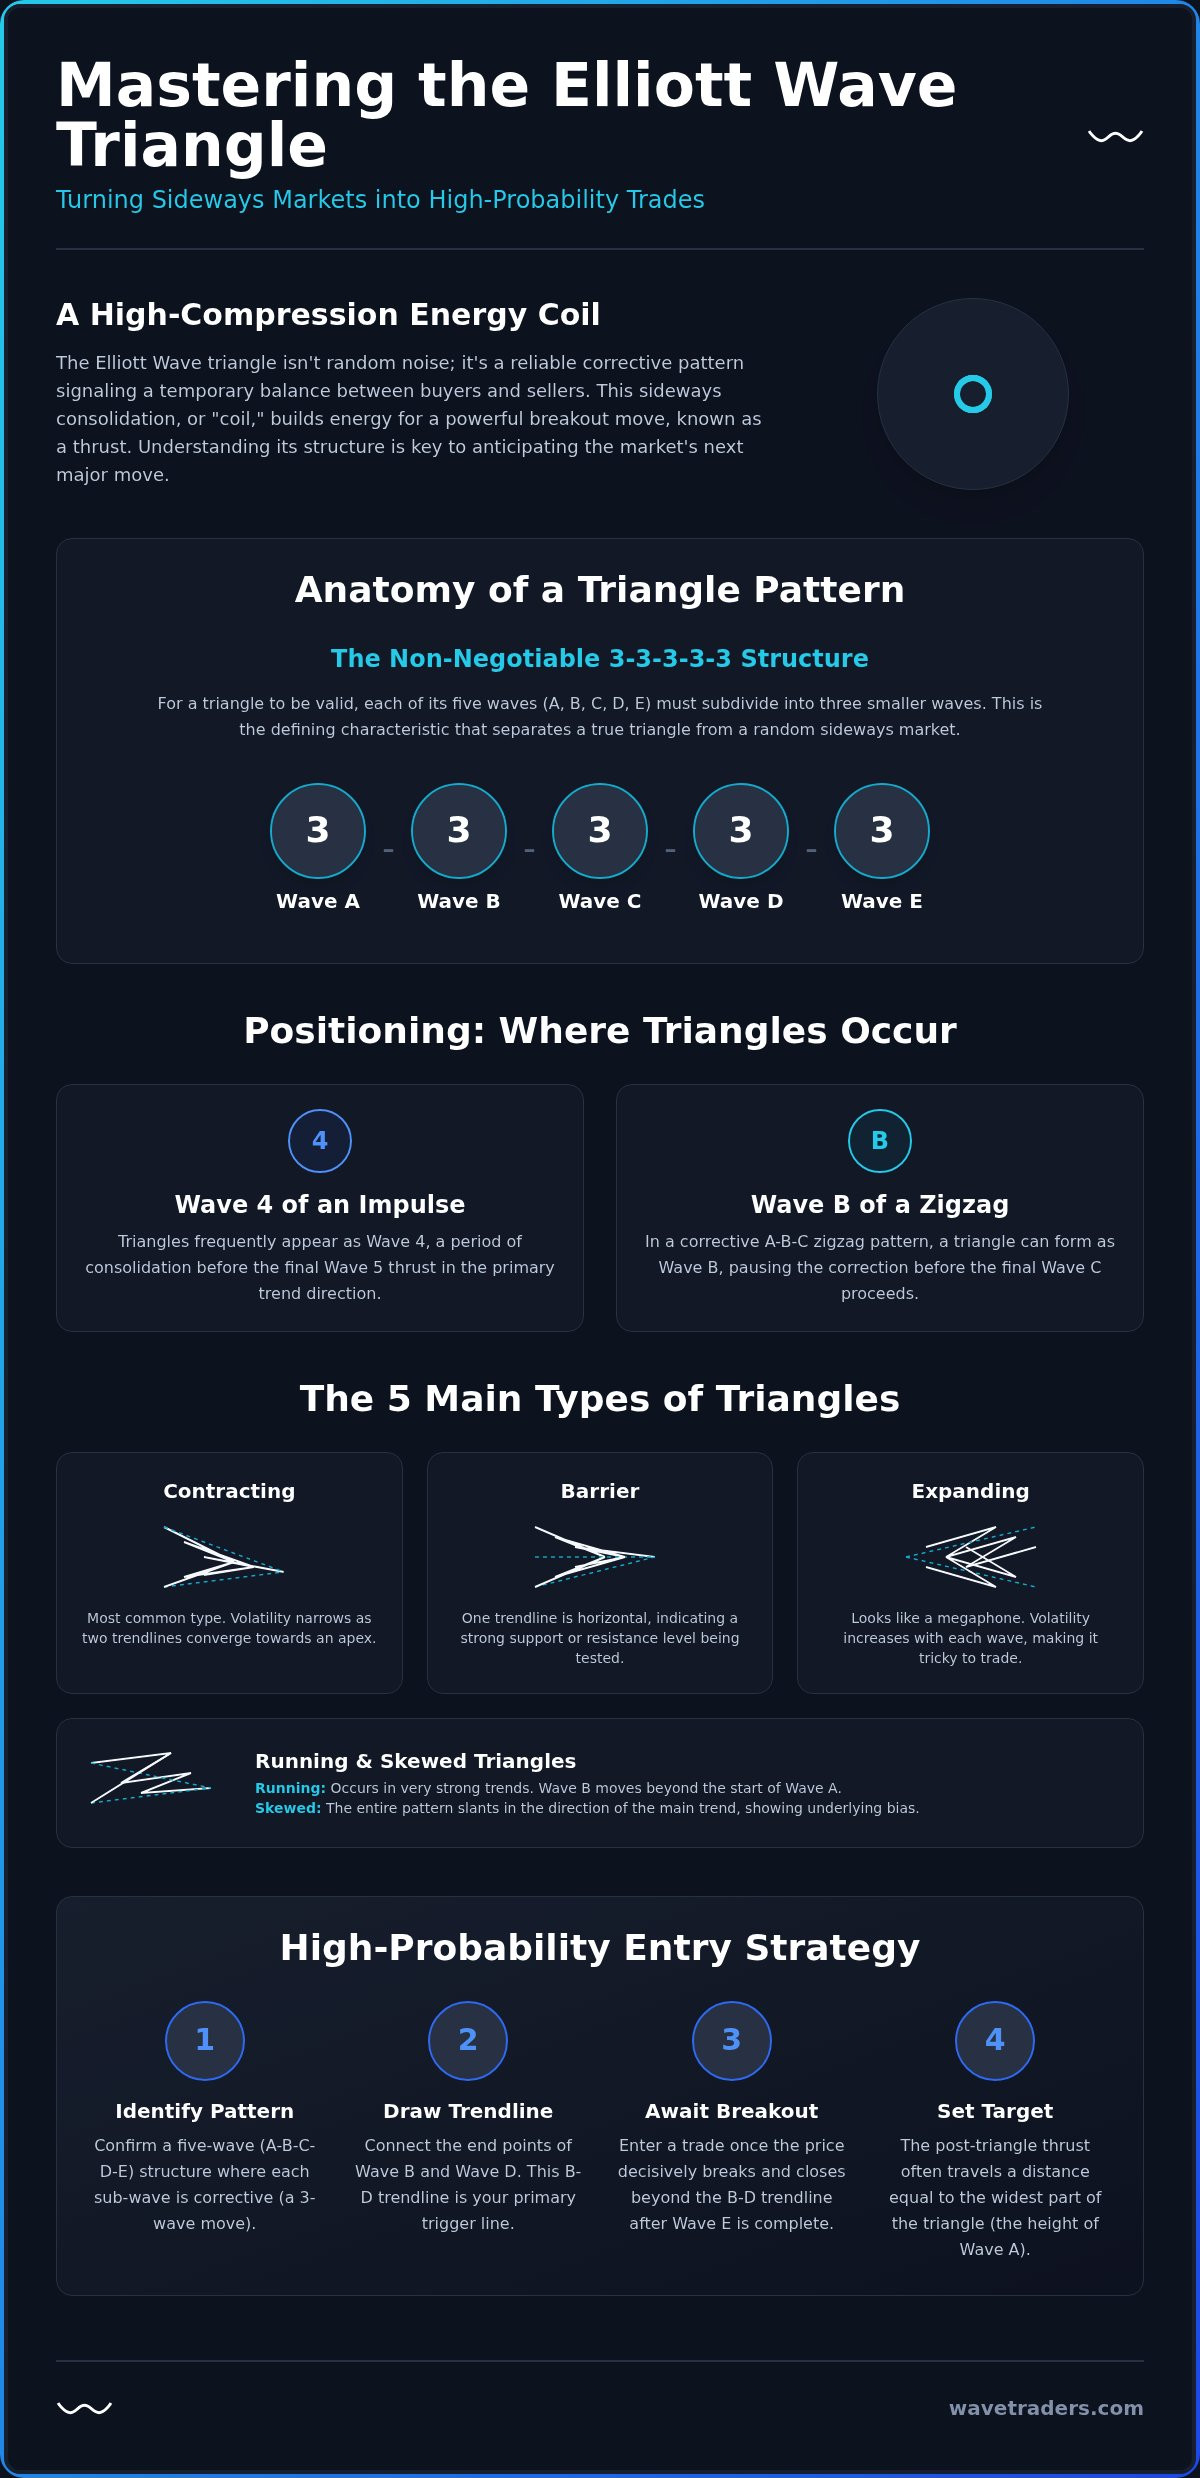
What if the most frustrating sideways market isn’t a sign to walk away, but a high-compression energy coil preparing for its most predictable move? Many traders view a tightening range as mere noise, yet the Elliott Wave triangle pattern is actually one of the most reliable structures for anticipating a powerful breakout. It’s understandable if you’ve felt the sting of getting stopped out during a volatile wave D or E. We’ve all been there, watching the market finally thrust in our intended direction just moments after our position was liquidated.
You’re right to feel that these patterns are tricky, especially when a simple flat correction masquerades as something more complex. This guide will help you master the ABCDE structure so you can stop guessing and start labeling with confidence. We’ll explore how to accurately predict the direction of the post-triangle move and use these setups to pass funded trader challenges. By the end of this article, you’ll have a clear framework for turning sideways frustration into a disciplined trading edge.
The Elliott Wave triangle pattern is a unique corrective structure that reflects a temporary balance between buyers and sellers. While most corrections like zigzags or flats move against the trend with some aggression, triangles represent a period of sideways consolidation. This pattern consists of five overlapping waves labeled A, B, C, D, and E. It’s essentially a pause in the prevailing trend, allowing the market to catch its breath before the final move of the sequence.
One of the most critical aspects of the Elliott Wave principle is the internal subdivision of these waves. For a triangle to be valid, each of the five waves must subdivide into three smaller waves. This creates a mandatory 3-3-3-3-3 sequence. If you see a sub-wave that looks like a clear five-wave impulse, you’re likely misidentifying the structure. This subdivision is why triangles feel so choppy; they’re composed entirely of corrective price action that lacks a clear directional bias until the very end.
As the pattern moves toward Wave E, you’ll notice that volatility and volume typically decline. This creates what we call a coil effect. The market is compressing energy into a smaller and smaller range. Once Wave E completes, this energy is released in a thrust. This move is usually fast and powerful, often covering a distance roughly equal to the widest part of the triangle, which is the height of Wave A. It’s the market’s way of quickly resolving the indecision that built up during the consolidation.
To keep your counts accurate, you must follow a few non-negotiable rules. First, a triangle always occurs in a position prior to the final wave of the larger sequence. This means you’ll find them in Wave 4 of an impulse or Wave B of a zigzag. Second, in a contracting Elliott Wave triangle pattern, Wave C never moves beyond the start of Wave A. Finally, the sub-waves are almost always zigzags or multiple zigzags, maintaining that corrective personality throughout the entire sideways move.
While rules are absolute, guidelines help you manage expectations. You should draw trendlines connecting the ends of waves A and C, and B and D. These lines typically converge toward an apex. However, don’t expect perfection. Wave E often undershoots the trendline, ending before it touches it, or overshoots it briefly to trap impatient traders. We also look for time symmetry. If Wave A took several days to form, it’s unlikely the entire rest of the pattern will finish in just a few hours. Patience is your greatest asset when these structures begin to develop.
Since these patterns can take considerable time to complete, finding ways to stay occupied without over-analyzing the screen is vital. For those looking to unwind with premium content during the wait, you can learn more about Edge IPTV and their extensive range of internet-delivered television channels.
While the internal 3-3-3-3-3 subdivision defines the pattern’s structure, the visual container of the Elliott Wave triangle pattern can take five distinct forms. Each variation offers a different clue about the underlying market psychology and the likely intensity of the following move. Recognizing these shapes early helps you adjust your expectations for the coming thrust.
Contracting triangles are the most common variation. In this structure, volatility steadily narrows, creating two converging trendlines that meet at an apex. Barrier triangles are similar, but they feature one horizontal trendline, usually the B-D line. This indicates a specific price ceiling or floor that the market is struggling to break. Expanding triangles are the opposite of the contracting type; they resemble a megaphone as volatility increases with each sub-wave. Running triangles occur when the trend is exceptionally strong, causing Wave B to start beyond the origin of Wave A. Finally, skewed triangles are patterns that slant in the direction of the main trend, showing a persistent bias even during consolidation.
The psychology of a barrier triangle is particularly interesting for traders. When one trendline is horizontal, it suggests that a significant pool of liquidity is being defended at a specific level. Once that level finally gives way, the breakout is often more explosive than a standard contracting triangle. It’s easy to mistake a barrier triangle for a flat correction, but the wave count is your guide. A flat has three sub-waves in Wave C, whereas a triangle must have five waves (A-B-C-D-E). Identifying the apex of these converging lines also helps you time your entry, as the thrust typically begins near the point where the lines would intersect.
Expanding triangles are often called the trader’s nightmare because they produce higher highs and lower lows. This price action frequently triggers stop-loss orders on both sides of the market before a direction is finally chosen. If you identify an expanding structure, it’s often best to sit on the sidelines until Wave E completes. Running triangles, on the other hand, are a sign of immense strength. They suggest the market is so eager to resume the trend that the correction can’t even move significantly against it. These often precede a massive Wave 3 or Wave 5 move. If you’re struggling to identify these nuances in real-time, the Elliott Wave School offers structured paths to help you master these complex counts.
Be careful not to mislabel a running triangle as an expanded flat. While both involve a Wave B that exceeds the start of Wave A, the internal structure remains the ultimate arbiter. A running triangle will always show that corrective 3-3-3-3-3 subdivision, signaling that the energy is still coiling for a final, powerful resolution. If you want to develop the skills to distinguish these patterns in live FX markets, enrolling in a structured Elliott Wave forex course focused on real-time execution can help you bridge the gap between theory and practice.
The Elliott Wave triangle pattern is unique because it only appears in specific locations within the larger market structure. It’s essentially a “penultimate” move, meaning it occurs just before the final wave of a sequence. This positioning is one of the most valuable pieces of information for a trader. When you identify a triangle, you aren’t just looking at sideways price action; you’re looking at a signpost that the current trend is nearing its conclusion. Understanding this context prevents you from overstaying your welcome in a trade or misjudging the scale of the next move.
One of the most reliable guidelines in wave theory is the Rule of Alternation. This rule suggests that the market seeks balance in its corrective phases. If Wave 2 of an impulse was a sharp, deep correction that moved quickly, Wave 4 is highly likely to be a sideways, time-consuming pattern like a triangle. Crucially, an Elliott Wave triangle pattern cannot occur as Wave 2. If your count suggests a triangle is forming early in a trend, it’s a signal to re-examine your labels, as you may be witnessing a more complex corrective structure instead.
When a triangle appears in the Wave 4 position, it signals that the preceding trend has one final push left. Traders use the widest part of the triangle, typically Wave A, to estimate the target for the subsequent Wave 5. This “thrust” often travels a distance roughly equal to the height of Wave A projected from the end of Wave E. In our EUR/USD Elliott Wave analysis, we frequently use these Wave 4 structures to identify exhaustion points in major currency cycles. It allows us to participate in the final move with a clear exit strategy in mind.
Triangles also frequently appear as Wave B within a larger zigzag correction. This positioning is significant because it sets the stage for a final Wave C, which often moves with the speed and personality of an impulse wave. This is sometimes referred to as a “kill zone” because the thrust out of a Wave B triangle can be devastatingly fast. Additionally, triangles can serve as the final component of a complex “Double Three” or “Triple Three” structure, such as a W-X-Y count. In these scenarios, the triangle acts as the final link (Wave X) or the concluding pattern (Wave Y), marking the resolution of a prolonged period of market indecision before the primary trend resumes.
Trading the Elliott Wave triangle pattern requires a shift in mindset from aggressive chasing to patient observation. Because this structure is a consolidation of energy, the breakout is often swift, leaving little time for indecision once the move begins. Your goal is to identify the precise moment when the “coil” is ready to release. This process starts by waiting for Wave E to complete its final sub-wave, which typically seeks a touch of the trendline connecting waves A and C.
Success in execution depends on a clear trigger. While some traders attempt to “pick the bottom” of Wave E, it’s often safer to wait for a break of the B-D trendline or a violation of a recent price pivot. This confirms that the sideways energy has finally shifted into a directional thrust. Once your entry is triggered, place your stop loss at the extreme of Wave E. If the market is particularly volatile, using the extreme of Wave C provides a more robust, though wider, invalidation level. If the price moves beyond these points, your triangle count is likely incorrect, and it’s time to step aside.
To calculate your profit target, measure the widest part of the pattern, which is the vertical distance at the start of Wave A. You then project this distance from the end of Wave E in the direction of the breakout. This provides a baseline target for the ensuing thrust. For a more nuanced approach, many professionals use Fibonacci extensions. A 0.618 extension of the Wave A height offers a conservative exit, while a 1.0 extension represents a full measured move. In high-volatility markets like Gold, these targets are often exceeded, so trailing your stop once the initial target is hit can help capture additional gains.
One of the most common frustrations is the Wave E overshoot. This happens when the price briefly pierces the A-C trendline before reversing sharply into the thrust. To avoid being shaken out by these final wicks, look for RSI divergence on a lower timeframe to confirm that momentum is exhausting. Additionally, keep an eye on the “Apex” of the triangle. Most reliable breakouts occur between 60% and 80% of the way to the apex. If the price drifts all the way to the point where the trendlines meet, the pattern often loses its explosive potential. If you’re ready to apply these rules to live markets, our FX Service provides real-time identification of these setups across major pairs.
Finally, remember the nature of the move following the thrust. Because triangles occur in the penultimate position, the move that follows is usually the final leg of a larger sequence. Once your target is reached, be prepared for a sharp reversal. The market has completed its cycle and will likely begin a larger correction or a trend change, making it vital to take profits rather than hoping for an extended run.
Static charts in textbooks often make the Elliott Wave triangle pattern look like a perfect, clean geometric shape. In live markets, price action is rarely that simple. Seeing a triangle develop in real-time is where the true skill of a practitioner is forged. It’s one thing to label an ABCDE structure after the thrust has already occurred; it’s another to identify the coiling energy as Wave E is still forming. Our goal is to help you bridge that gap between theory and execution.
The Wave Theory Trading Course is designed for traders who want to move beyond basic counts. We focus on the nuances of corrective structures that often confuse retail traders. By utilizing our FX and Digital Currency services, you can watch how our analysts track these sideways markets daily. This provides a real-time look at how professional pattern recognition works before the breakout happens, giving you the confidence to act when the market finally moves.
The school provides a deep dive into complex corrective patterns through a series of structured video lessons. We don’t just show you finished counts. We walk through live chart examples from current 2026 markets, showing you how to handle overlapping waves and ambiguous price action. One of the most valuable aspects is the interactive feedback. You can have your own wave counts verified by experienced practitioners, ensuring you aren’t falling into the common trap of mislabeling a flat as a triangle. Traders who struggle with analysis paralysis when managing live positions will find that a structured Elliott Wave school focused on professional trading execution provides the systematic framework needed to move from theory to confident, real-time decision-making.
Mastering triangles is a significant advantage if you’re looking to pass a Funded Trader Program challenge. These patterns are ideal for prop trading because they naturally provide some of the tightest stop-loss placements in technical analysis. Since you’re entering at the end of a compression phase, your risk is clearly defined at the extreme of Wave E. This allows you to maintain high risk-to-reward ratios while strictly managing your drawdown levels.
We’ve seen many members use these high-probability “Thrust” setups to meet the technical requirements of professional funding. Currently, there is a 30% discount available for those entering the Funded Trader Program through our partnership. If you’re ready to stop guessing and start trading with a methodical edge, we invite you to apply for membership and track these patterns with our community.
Mastering the Elliott Wave triangle pattern allows you to stop viewing sideways price action as a period of uncertainty and start seeing it as a high-probability trade setup. By recognizing the specific 3-3-3-3-3 subdivision and the penultimate positioning of these structures, you can accurately anticipate the direction and scale of the subsequent thrust. Whether you’re navigating a contracting barrier or a rare running triangle, the key is patience and disciplined execution of the entry rules we’ve discussed.
At Wavetraders, we’ve provided expert market analysis since 2003, helping our members identify these patterns in real-time across FX and Digital Currency markets. If you’re looking to apply these skills professionally, remember that our partnership offers 30% off access to the Funded Trader Program. You don’t have to track these complex cycles alone. We invite you to master pattern recognition in our Elliott Wave School and join a community of like-minded practitioners. With the right framework, the most frustrating market environments often become your most profitable ones.
No, a triangle cannot occur as Wave 2 in an impulsive sequence. According to the core rules of wave theory, triangles are strictly reserved for the penultimate position in a sequence. This means you’ll only find them in Wave 4 of an impulse, Wave B of a zigzag, or as part of a complex correction like Wave X or Y. If you see a triangle forming early in a trend, it’s a signal to re-evaluate your count.
The primary distinction lies in the internal sub-wave count and the number of legs. An Elliott Wave triangle pattern consists of five waves labeled A-B-C-D-E, while a flat correction only has three legs labeled A-B-C. Furthermore, every sub-wave within a triangle must be a corrective three-wave structure. In a flat, the final Wave C is always a five-wave impulsive move, which provides a much different momentum profile.
A running triangle occurs when Wave B starts beyond the origin of Wave A. In a bullish trend, this formation is a sign of extreme strength because it shows that buyers are so aggressive they won’t let the market correct deeply. It suggests that the underlying trend is powerful and that the following thrust will likely reach its targets quickly. Traders view this as a high-conviction signal that the primary trend remains fully intact.
Yes, these patterns are fractal and appear on all timeframes, including 5-minute charts. However, intraday structures often contain more market noise and are prone to false breakouts compared to higher timeframes. Many practitioners find the Elliott Wave triangle pattern to be most reliable on hourly or daily charts where the coiling volume and price compression are more clearly defined and less influenced by minor news events.
The market typically undergoes a sharp and fast reversal once the thrust move reaches its measured target. Because triangles occur in the position immediately preceding the final move of a sequence, the thrust represents the exhaustion of the current trend. Once this final leg finishes, the entire larger structure is complete, which usually leads to a significant trend change or a deep correction in the opposite direction.
Wave E is challenging because it’s the point where market indecision and psychological exhaustion are at their peak. It often fails to reach the A-C trendline or briefly overshoots it to trap breakout traders before the real move begins. This final sub-wave is frequently choppy and slow, leading many traders to lose patience or get stopped out by a minor price wick just moments before the thrust move finally ignites.
Volume serves as a vital secondary confirmation tool during the formation of the pattern. In a standard contracting triangle, volume should steadily diminish as the price range narrows toward the apex. This decline reflects a temporary balance of forces and a lack of conviction from both buyers and sellers. A sudden, sharp increase in volume usually accompanies the breakout, confirming that the consolidation phase has ended and the thrust is underway.
Yes, it’s possible for one of the sub-waves, most commonly Wave E, to subdivide into its own smaller triangle. This creates a “triangle within a triangle” and usually indicates that the consolidation period is extending in time. While this can be frustrating for traders waiting for a breakout, it often leads to a more explosive thrust move because the market has spent additional time coiling energy within an even tighter price range.
DISCLAIMER
Any reviews, news, analysis, prices or other information contained on our website is provided as general market commentary and delivered electronically through a distribution channel to larger number of clients, therefore does not constitute investment advice or investment research. We are not trading advisors. Most of our work is for educational purposes only, with information based on Elliott Wave theory in real time. Trading forex, futures, options, stocks, cryptocurrenices or any another trading market carries a high level of risk, and may not be suitable for all investors.
The possibility exists that you could lose some or all of your initial investment; therefore you should not invest money that you cannot afford to lose. Our website and the information that we provide should not be relied upon as a substitute for extensive independent research before making your investment decisions. In no event will we be liable for any loss or damage on your account in connection with, the use of our products. For any real cash investments you have to contact your financial advisor.
Any information or material contained on our website is owned by Val Global d.o.o.. Reproduction is prohibited without Val Global d.o.o. prior license in writing.
By continuing to use the site, you agree to the use of cookies. Learn more.
The cookie settings on this website are set to "allow cookies" to give you the best browsing experience possible. If you continue to use this website without changing your cookie settings or you click "Accept" below then you are consenting to this.