XRPUSD is trapped in consolidation as recent sideways corrective running triangle structure suggests more weakness.
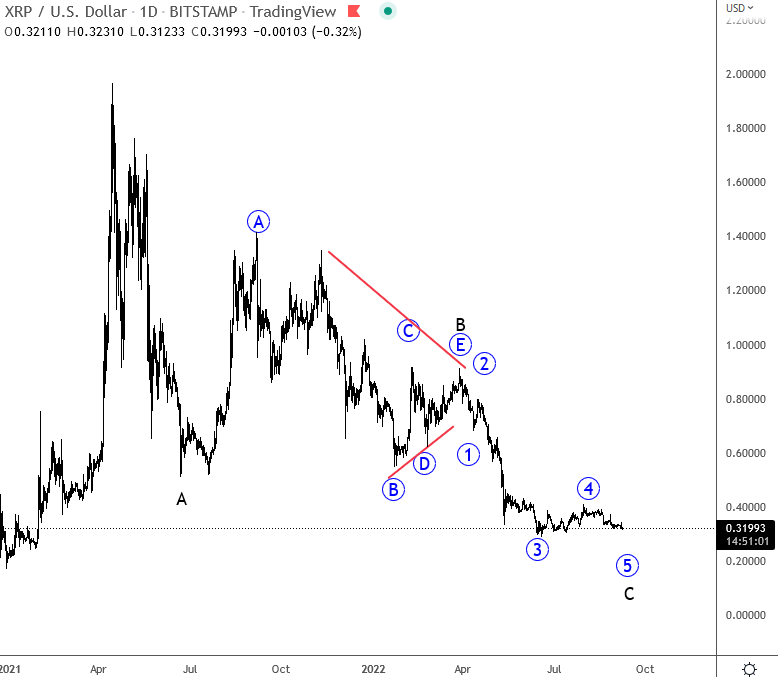
Ripple – XRPUSD is bearish for the last year, but looking at the daily chart, we see an A-B-C corrective decline from April 2021 highs. It’s actually already trading in final stages of wave C and it can be slowly approaching the end. Wave C is a motive wave and it should be completed by a five-wave cycle of the lower degree, but looks like final subwave of 5 of C is still missing.

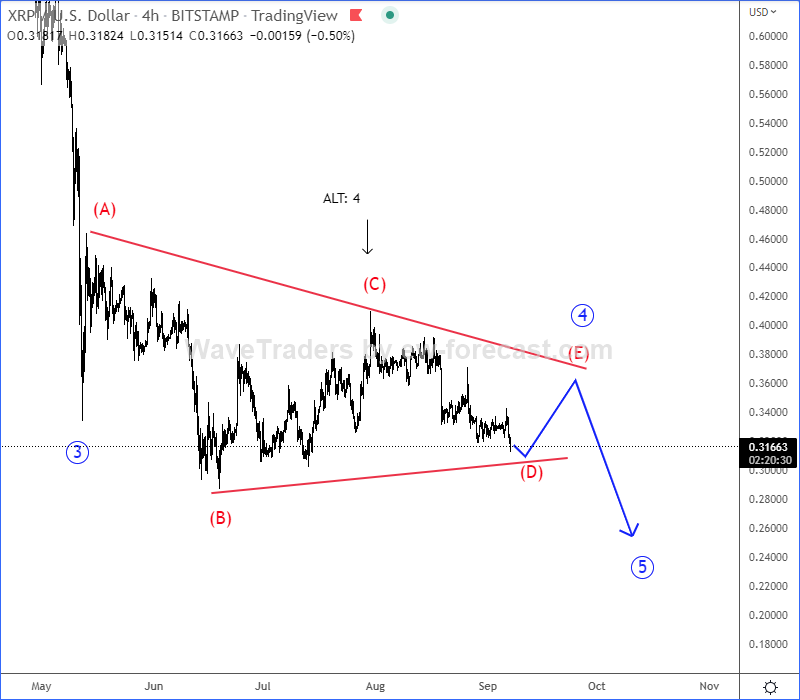
Looking at the 4-hour chart, we can see a sideways corrective structure which indicates for a bearish running triangle pattern within wave 4, but we may see some rally as final subwave (E) may still occur. So, once a triangle is fully completed, watch out for a continuation lower within final 5th wave of C. If from any reason we see a strong bounce back above 0.5 then bulls can be back, especially if rise would be in five waves.

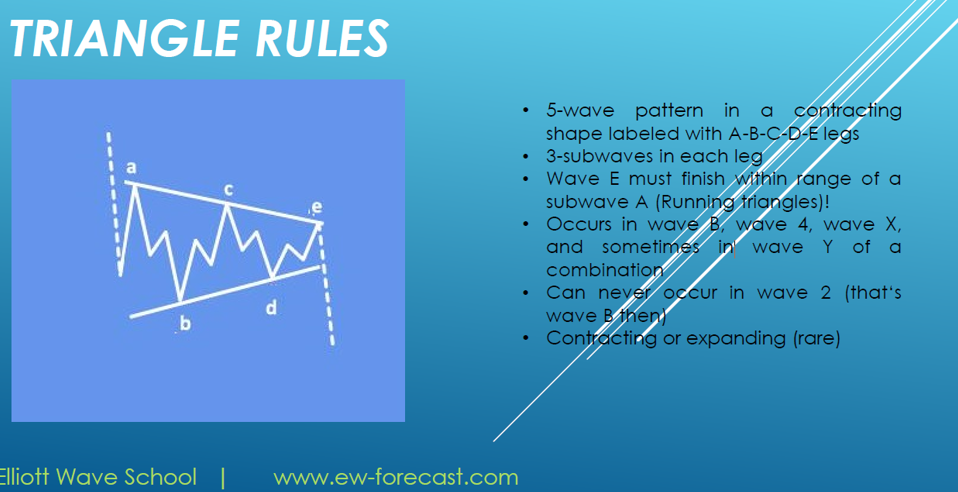
What is a triangle?
Corrective pattern with converging trendlines, subdividing 3-3-3-3-3 and labeled A-B-C-D-E. Occurs in wave 4, B, X or Y wave.
How to trade it?
Option 1: Small position size on projection for wave »e«, with stops beyond wave »a«. Trail stops when »b-d« triangle line is broken, and add to your position. Trail stops to latest entry when market breaks to new highs/lows
Option 2: Normal position size when wave »b« is broken, with stops beyond wave »e«. Pull stops to entry when market breaks to new highs/lows.
Want to learn more about Elliott waves? Check our Elliott Wave Educational material here

Check also our latest Litecoin – LTCUSD chart. CLICK HERE