Stocks

SP500 Is Looking For A Bigger RecoveryMay 19, 2023

SP500 is looking for a bigger recovery mode, as we see it coming higher after a corrective consolidation by Elliott Wave theory.

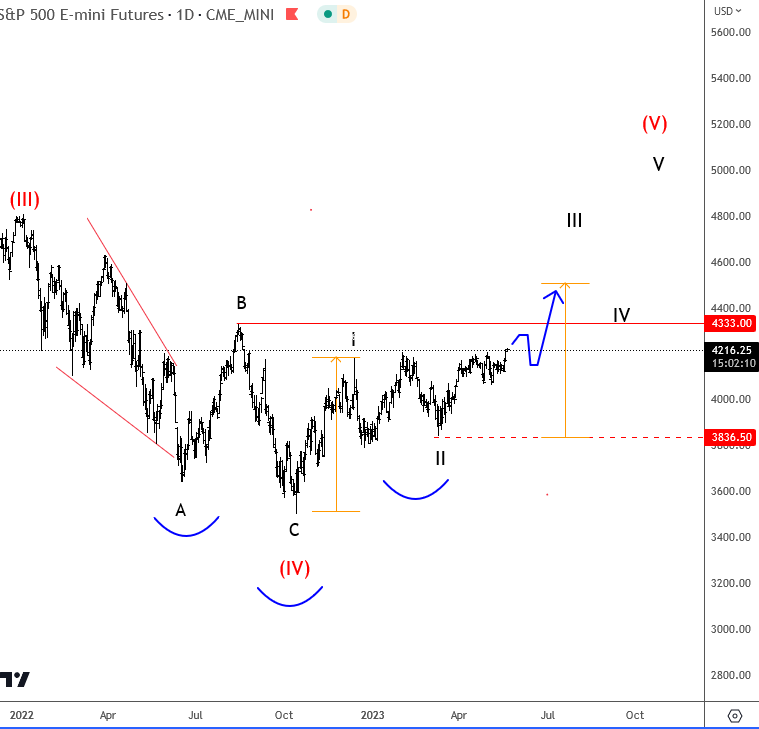
SP500 has been trading sideways for some time and it was ideally trapped in consolidation, which we see it as a bullish triangle. It’s a five-wave move between two contracting trendlines that can be completed now after recent push higher. If stays at highs, above 4200 level for a weekly close, then we are pretty sure that bulls are on track. We are tracking two daily counts at te moment, and both suggest there can be room for more upside, either for wave C regarding primary count or maybe even wave 3 of a five-wave bullish impulse according to secondary count.
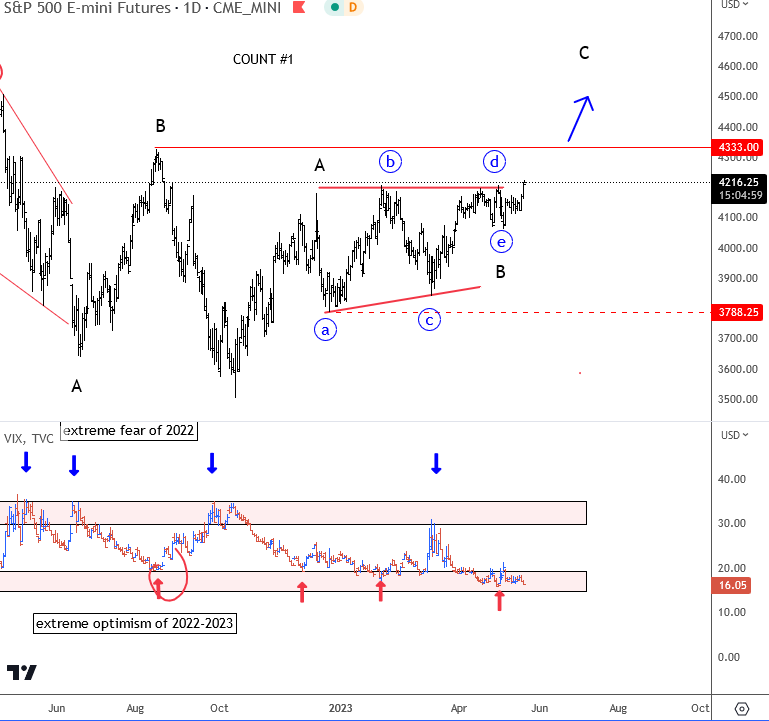
SP500 Is Looking For A Bigger Recovery Daily Chart Count #1
SP500 Daily Chart Count #1
SP500 Is Looking For A Bigger Recovery Daily Chart Count #2
SP500 Daily Chart Count #2

Even if we take a look on SPX/ZN (SP500 against 10Y US Notes) ratio chart, now that 10Y US Notes is slowing down and SP500 extending its rally, SPX/ZN ratio chart is finally breaking a larger bullish triangle pattern. It means that stocks will be doing much better than bonds in upcoming weeks/months.
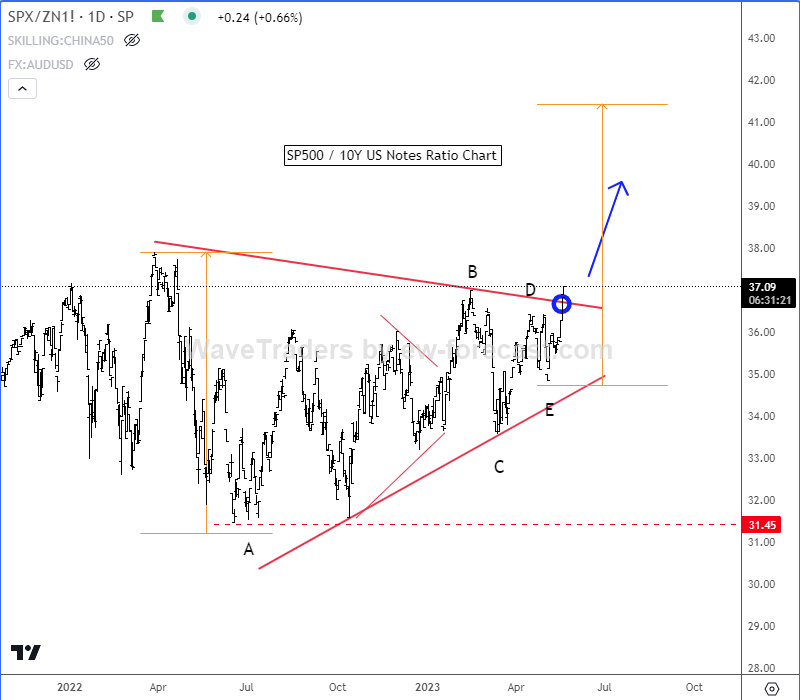
SP500 Is Looking For A Bigger Recovery SPX/ZN Ratio chart
SPX/ZN Daily Ratio Chart

On the intraday basis SP500 is breaking higher above 4206 level, which means that can it be now unfolding a new intraday bullish impulse. We are tracking wave »iii« of 3 that can push the price up to 4270 – 4300 area, just be aware of 4th wave pullbacks. As long as the price is above 4155 invalidation level, we can expect a bullish continuation.
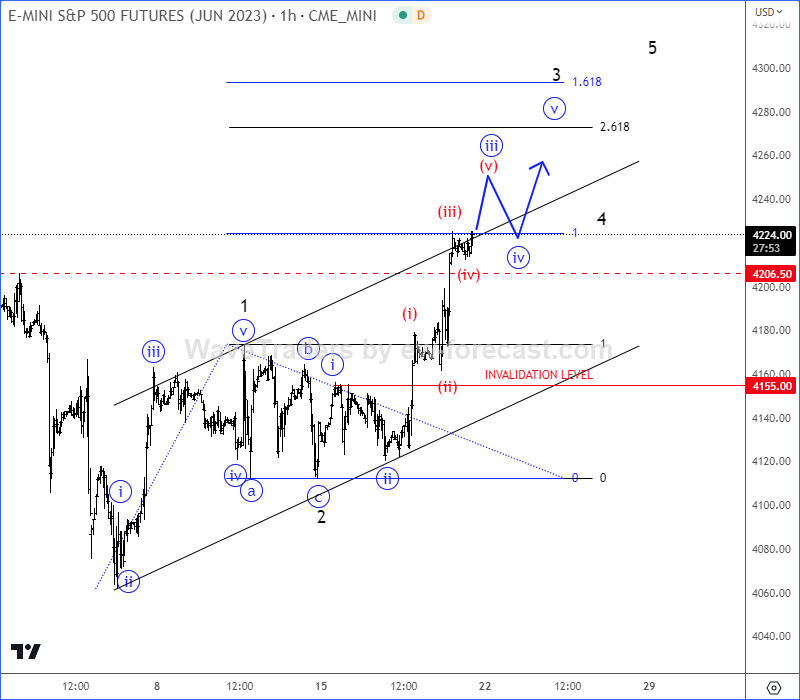
SP500 Is Looking For A Bigger Recovery intraday 1h chart
SP500 1H Chart

Become a premium member

Get daily Elliott Wave updates for CRYPTO, FIAT, SP500, gold, silver, crude etc. or apply for unlimited access to the Elliot Wave educational videos.

Nakamoto.Games Is Trading In A Bullish Impulse. Check our free chart HERE.

DISCLAIMER

Any reviews, news, analysis, prices or other information contained on our website is provided as general market commentary and delivered electronically through a distribution channel to larger number of clients, therefore does not constitute investment advice or investment research. We are not trading advisors. Most of our work is for educational purposes only, with information based on Elliott Wave theory in real time. Trading forex, futures, options, stocks, cryptocurrenices or any another trading market carries a high level of risk, and may not be suitable for all investors.

The possibility exists that you could lose some or all of your initial investment; therefore you should not invest money that you cannot afford to lose. Our website and the information that we provide should not be relied upon as a substitute for extensive independent research before making your investment decisions. In no event will we be liable for any loss or damage on your account in connection with, the use of our products. For any real cash investments you have to contact your financial advisor.

Any information or material contained on our website is owned by Val Global d.o.o.. Reproduction is prohibited without Val Global d.o.o. prior license in writing.

By continuing to use the site, you agree to the use of cookies. Learn more.

The cookie settings on this website are set to "allow cookies" to give you the best browsing experience possible. If you continue to use this website without changing your cookie settings or you click "Accept" below then you are consenting to this.

Close