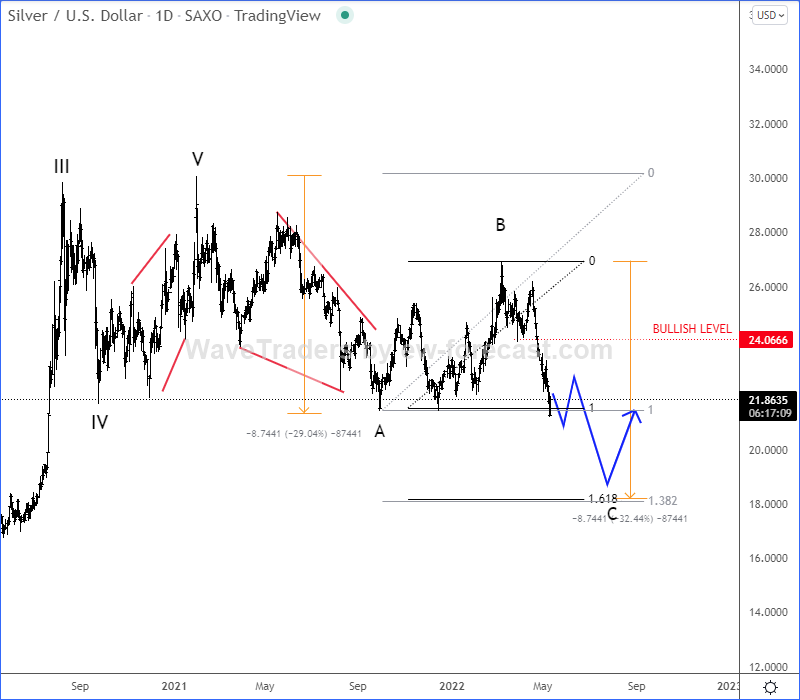
Hello traders and investors, today we will talk about silver chart. We see a pretty nice long-term opportunity as A-B-C corrective decline can be coming to an end into an important support.
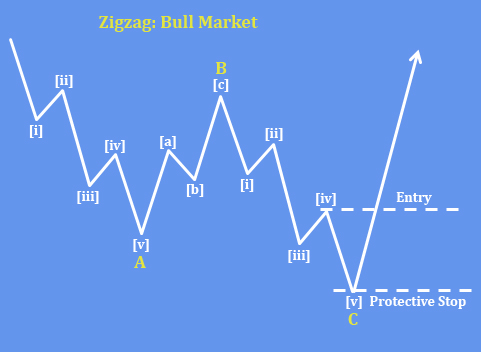
Silver is trading in an A-B-C correction but now that is coming into 2-year low, seems like support is near, ideally here around 20 – 18 area. On a silver daily chart we are already tracking wave C of an A-B-C correction, but wave C is a motive wave and it should be completed by a five-wave cycle of the lower degree. So, there can be still room for slightly lower levels before a bullish reversal. Keep also in mind that bulls could be back in the game only if we see a rally back above 24 region.
Happy trading!
What’s happening with Natural gas? Check our latest intraday chart