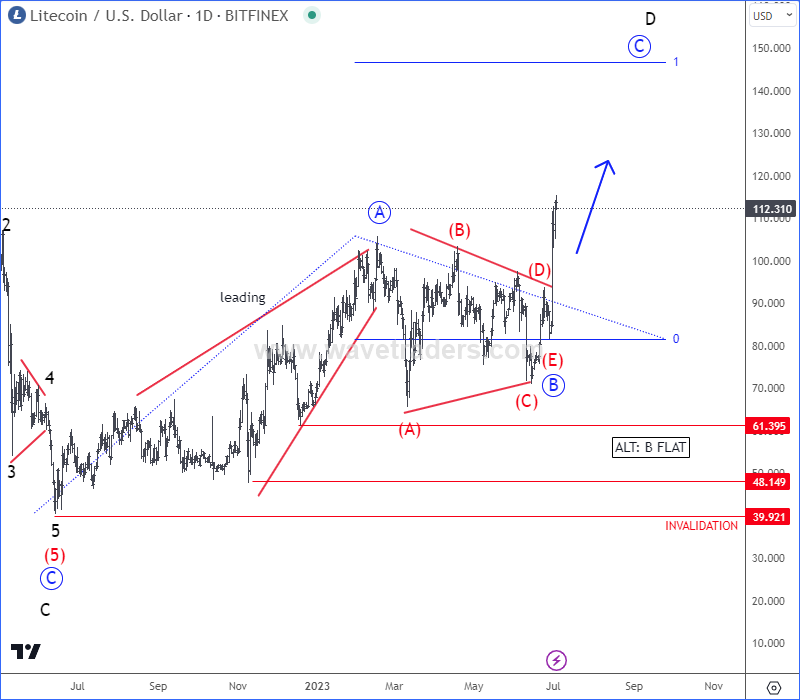
Litecoin is breaking higher as expected after we spotted a corrective triangle pattern by Elliott wave theory.
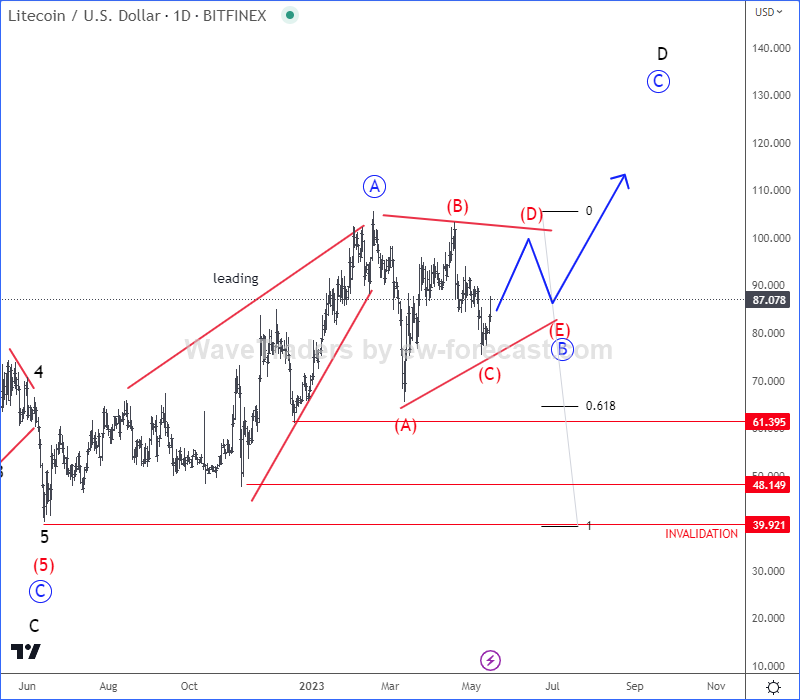
Litecoin with ticker LTCUSD has been trading sideways for the last couple of months, which we saw it as a bullish triangle pattern in wave B after a leading diagonal from the lows into wave A. A triangle is a continuation pattern that usually occurs in wave B and once it’s fully completed, this is when we can expect a bullish continuation within wave C.

As you can see today, LTCUSD is finally breaking higher above February highs, so triangle in wave B on a daily chart can be completed and higher degree wave C underway. It can now send the price at least up to 150 area or maybe even higher, just be aware of short-term pullbacks.

Seems like ALTcoin dominance is now kicking in, which can push the ALTcoins even higher in current ALT season. We talked about ALT season in our previous blog shared on June 27th. CLICK HERE
Become a premium member
Get daily Elliott Wave updates for US Single Stocks, SP500,DAX, GOLD, SILVER, CRUDE, FX, CRYPTO, etc. or apply for unlimited access to the Elliot Wave educational videos.
EURAUD Is Still In The Uptrend. Check our free chart HERE.