GBPJPY is in sideways consolidation, which we see it as a bullish running triangle pattern from Elliott wave perspective.
GBPJPY pair is still at the highs on a daily chart, which looks like a consolidation within uptrend, ideally as a bigger bullish running triangle pattern within higher degree wave (4).
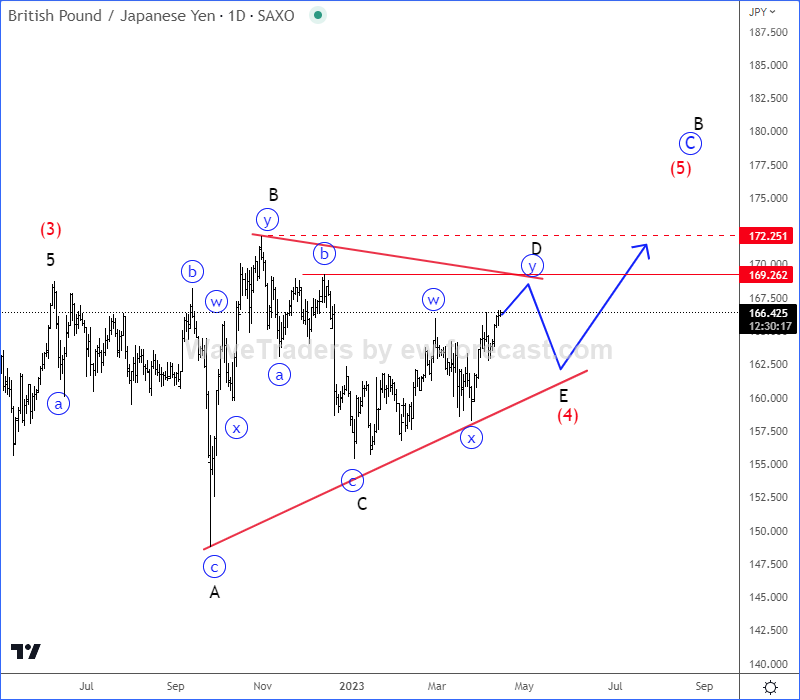
Currently we are tracking final stages of a complex w-x-y rally into wave D that can cause another wave E slow down. So, once a triangle fully unfolds, be aware of a retest of the highs for wave (5) of a higher degree wave C/B.
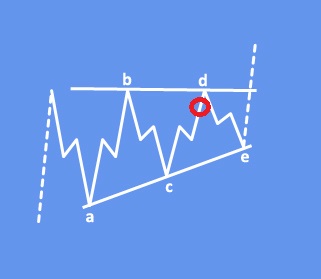
The running triangle is a region of horizontal price movement, a consolidation of a prior move, and it is composed of “threes.” That means each of the A-B-C-D-E waves have three subwaves.
For detailed view and for more analysis like this you can watch a recording of our latest live webinar from April 11 2023 below:
Become a premium member
Get daily Elliott Wave updates for US Single Stocks, SP500,DAX, GOLD, SILVER, CRUDE, FX, CRYPTO, etc. or apply for unlimited access to the Elliot Wave educational videos.