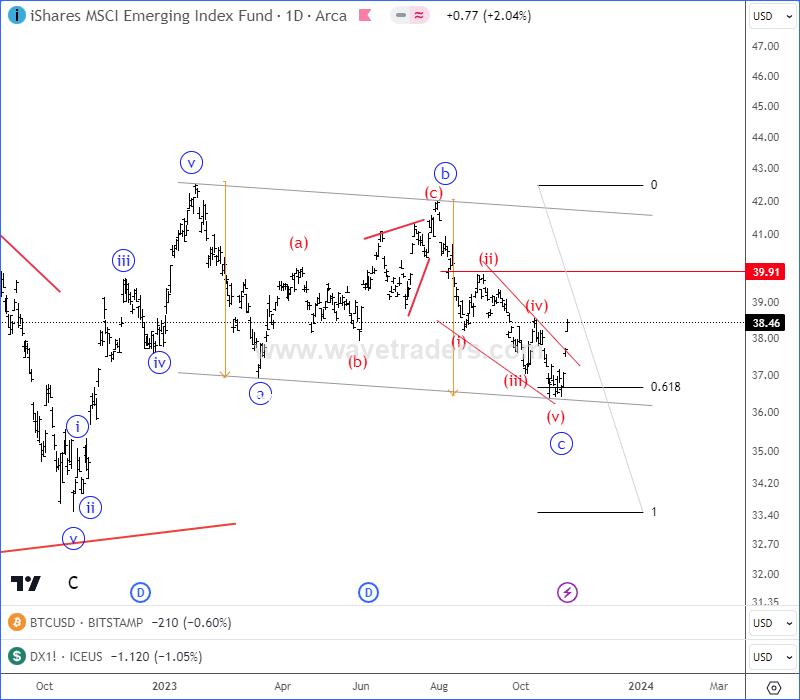
Emerging Markets Show A Completed Correction Within Uptrend from technical point of view and from Elliott wave perspective.
Emerging markets chart with ticker EEM has been trading slow and sideways for the last year, mainly because of weak China stocks. But, we have been warning about a corrective a-b-c movement with nice support at 61,8% Fibo. retracement and 36-35 area in the past months.
Check previous articles below:
EEM vs. USD Video Analysis From August 21. CLICK HERE
EEM Free Chart From September 21. CLICK HERE
As you can see today, EEM is bouncing sharply from projected support after a completed a-b-c corrective decline, which means that bulls can be now back in the game and it can be supportive for the stock market across the globe, especially Chinese stocks that can lift commodity currencies such as Aussie (AUDUSD) and Kiwi (NZDUSD) higher.

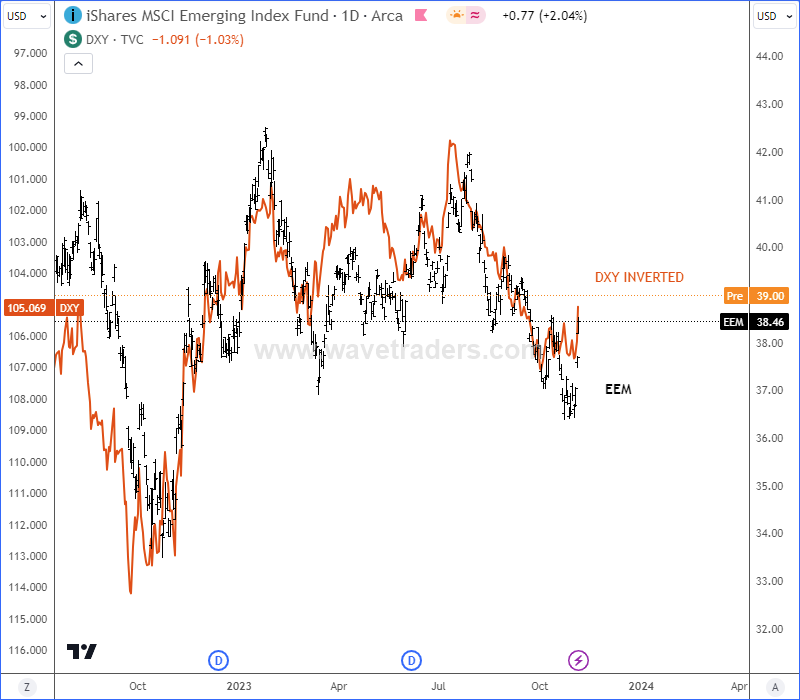
One of the main reason why Aussie and Kiwi can be pushed higher along with stocks is also a potential resistance for the USDollar. Now that EEM is bouncing from the support, we can see USDollar – DXY chart turning bearish due to a negative correlation. For a better visibility, how EEM and DXY are correlated, we just inverted the DXY chart.

You can also join us in live webinar today on Monday, Nov 06, 2023, @15.00 CET.
Become a premium member
Get daily Elliott Wave updates for US Single Stocks, SP500,DAX, GOLD, SILVER, CRUDE, FX, CRYPTO, etc. or apply for unlimited access to the Elliot Wave educational videos.
LINKUSD Found Projected Strong Support. Check our blog HERE.