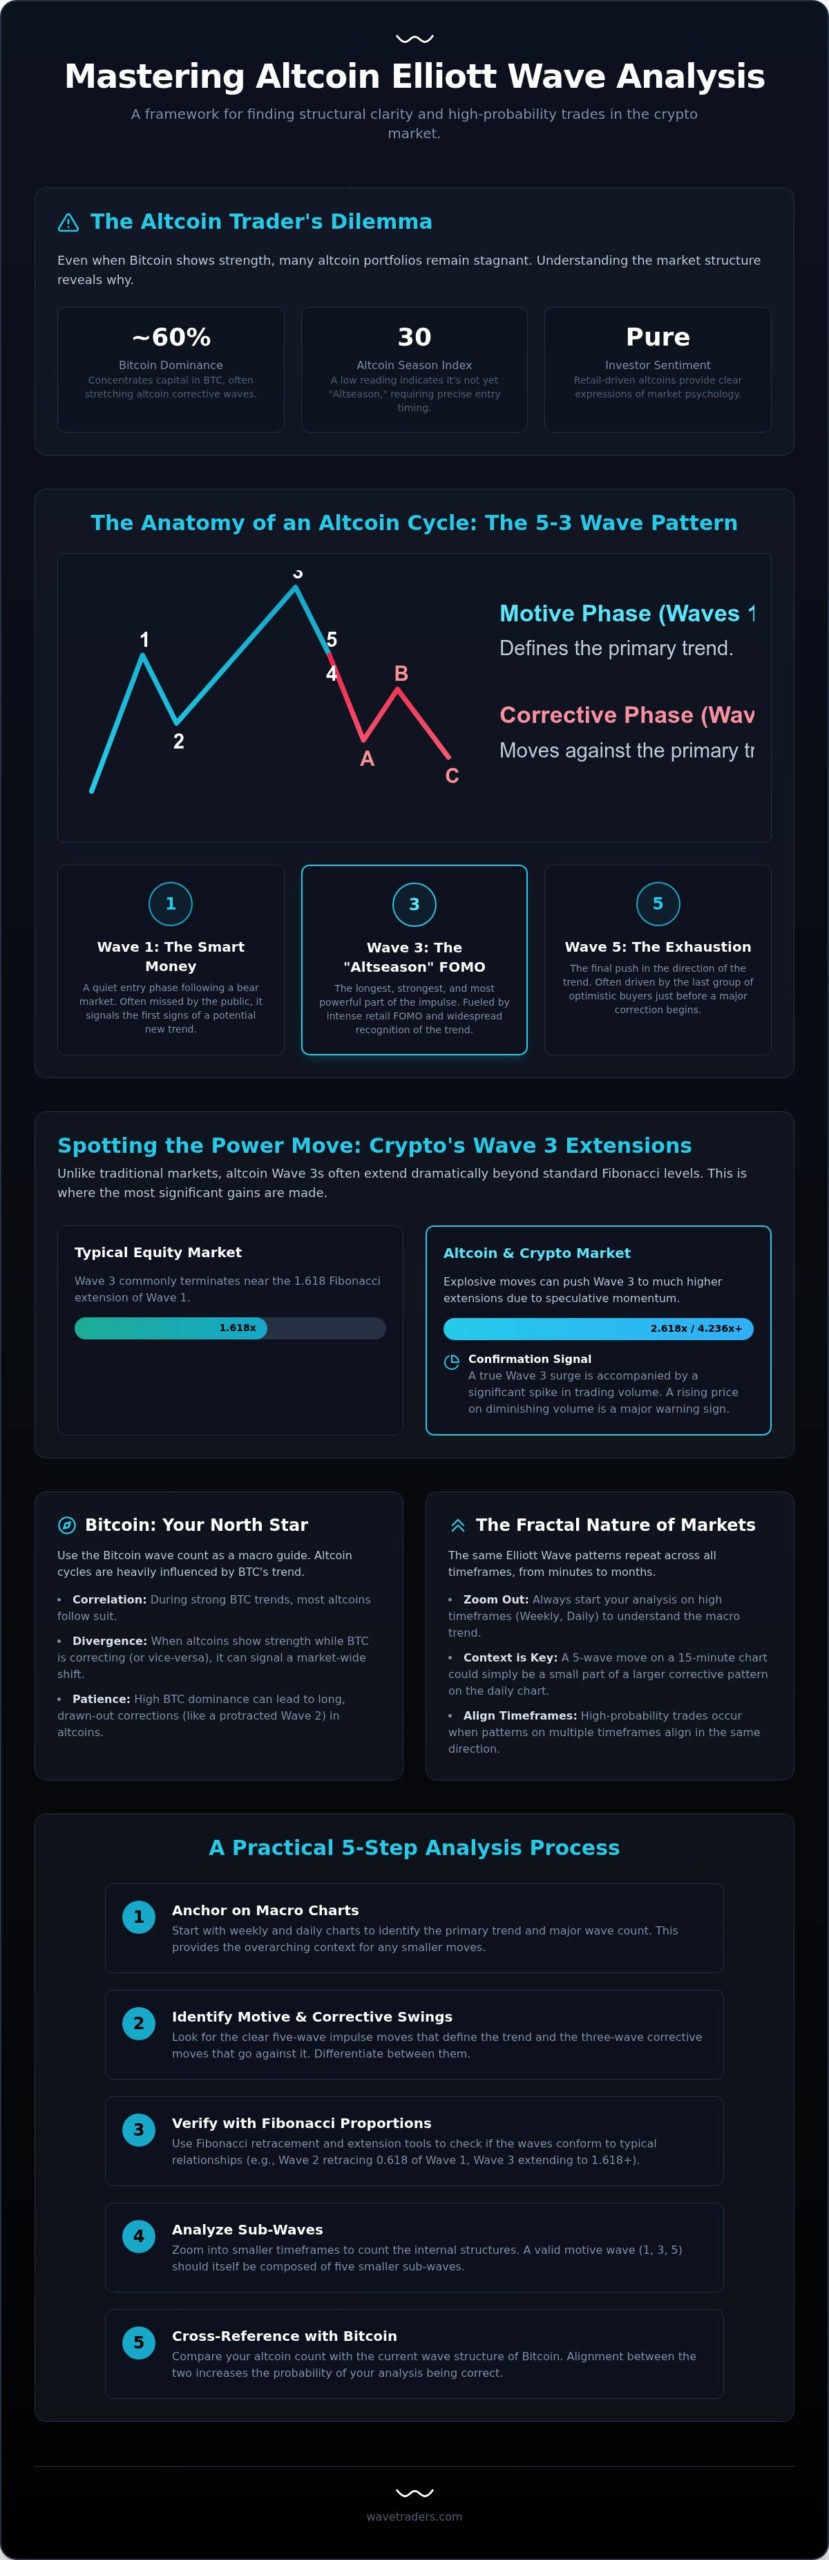
Why does your altcoin portfolio feel like it’s stuck in a permanent correction even when Bitcoin shows signs of life? It’s frustrating to watch Bitcoin dominance hover near 60% while your favorite projects struggle to find a floor. You’ve likely felt the sting of getting stopped out by a sudden liquidation cascade or felt the anxiety of a wave count that simply doesn’t align with the broader market. Mastering altcoin Elliott Wave analysis is the key to moving beyond this confusion and finding the structural clarity required to trade with composure.
In this guide, you’ll learn how to apply a repeatable framework to identify high-probability setups even when the Altcoin Season Index is sitting at a low 30. We’ll examine the specific relationship between Bitcoin’s current consolidation and individual project cycles. This helps you time your entries and exits with much greater precision. We’ll map the unique volatility of the 2026 market by identifying the specific fractals of mass psychology that drive individual adoption cycles, giving you a clear roadmap for the months ahead.
Success in the crypto markets often depends on your ability to look past the immediate price action and see the underlying structure. Professional altcoin Elliott Wave analysis provides this clarity by tracking the collective sentiment of investors through repeatable patterns. At its core, this methodology identifies five-wave motive moves that define the trend and three-wave corrective patterns that challenge it. While many traders see chaotic price swings, the practitioner recognizes these as the natural ebb and flow of market psychology.
Altcoins are particularly well suited for the Elliott Wave Principle because they are driven heavily by retail participation. Unlike traditional equities, which are often influenced by institutional algorithms or complex derivatives, altcoins frequently display “pure” psychological fractals. This high level of retail emotionality makes the wave counts more distinct. However, there’s a significant difference between analyzing large-cap assets like Cardano or Solana and low-liquidity “gem” projects. Larger assets typically follow the rules of wave theory with more reliability, while micro-caps can produce erratic price spikes that require a more flexible interpretation of sub-wave structures.
In the 2026 market environment, where Bitcoin dominance remains high at approximately 60%, understanding wave symmetry is vital. When capital is concentrated in BTC, altcoin waves often stretch in duration or depth. You might see a protracted Wave 2 correction that tests your patience, even if the macro outlook remains bullish. Recognizing these structural nuances helps you stay grounded during periods of high volatility.
The progression of an altcoin’s price isn’t just a series of numbers; it’s a story of shifting sentiment. Wave 1 represents the “Smart Money” entry phase. It’s often quiet and missed by the general public because it follows a deep, exhausting bear market. Wave 3 is where the real “Altseason” occurs. This is the longest and most powerful part of the move, fueled by momentum and intense retail FOMO. Finally, Wave 5 marks the exhaustion move. This is where the last group of buyers enters the market, right before a major cycle correction begins.
One of the most powerful aspects of this theory is its fractal nature. A 15-minute altcoin count isn’t an isolated event. It’s a smaller piece of a much larger weekly macro trend. If you don’t “zoom out” to the daily or weekly charts, it’s easy to get lost in the noise of 24/7 crypto trading. By identifying different wave degrees, you can distinguish between a short-term scalp opportunity and a long-term investment setup. This perspective is what allows seasoned traders to remain calm when the market is dropping, as they can see whether the dip is a minor sub-wave or the start of a larger trend change.
Altcoins are famous for their explosive price action, but this volatility isn’t random. When applying altcoin Elliott Wave analysis, the most critical pattern to recognize is the Wave 3 extension. While traditional equities often see Wave 3 terminate near the 1.618 Fibonacci extension, crypto assets regularly push much further. This happens because the speculative nature of the asset class fuels a feedback loop of momentum that standard models often underestimate.
By 2026, the landscape has matured. With 1.29 million BTC held in U.S. spot ETFs, institutional liquidity has begun to smooth out some of the “wick” volatility that previously obscured wave structures. This means that while extensions remain powerful, the sub-waves within a motive move are often more legible than they were in previous cycles. Identifying these sub-waves is the difference between chasing a top and entering a sustainable trend. A genuine motive move will show a clear five-wave internal structure, whereas a corrective “fake-out” or B-wave typically only displays three sub-waves before reversing.
In the crypto market, Wave 3 extensions are the primary source of significant gains. It’s common to see these moves reach the 2.618, 4.236, or even higher Fibonacci levels. An extended wave is a motive phase that significantly exceeds the standard 1.618 Fibonacci projection. To confirm you’re in a true Wave 3 surge, you should look for a corresponding spike in the volume profile. If the price is rising on diminishing volume, you’re likely looking at an ending diagonal or a corrective rally rather than a powerful impulse. For those tracking these moves daily, the Digital Currency Service offers real-time counts to help distinguish between these scenarios.
Because altcoins are high-beta assets, their corrections are often deeper and more punishing than Bitcoin’s. It’s typical to see retracements reach the 0.618 or 0.786 levels. One of the most useful tools here is the Alternation Rule. If Wave 2 was a sharp, simple zig-zag, you should expect Wave 4 to be a complex, sideways pattern like a triangle or a flat. This helps you avoid the “Expanded Flat” trap, where price briefly breaks a previous high in a B-wave, tricking retail traders into buying the top right before the final C-wave flush. Recognizing these patterns allows you to maintain composure when others are reacting to short-term noise.
Bitcoin remains the undisputed “North Star” for the digital asset market. While individual projects have their own unique fundamentals, their price action is rarely independent of the king’s trajectory. In a professional altcoin Elliott Wave analysis, we always start with the Bitcoin macro count. If Bitcoin is engaged in a sharp Wave C liquidation, like the one that followed its October 2025 peak of $126,000, even the strongest altcoins will likely see their wave structures compromised. Bitcoin remains the king. Its momentum dictates the broader mood of the market.
Identifying “Altcoin Season” is a matter of tracking the Bitcoin Dominance chart alongside altcoin Elliott Wave analysis. Currently, in August 2026, Bitcoin dominance sits at approximately 58-60%. With the Altcoin Season Index at a low value of 30, it’s clear that the broader market hasn’t yet entered a confirmed impulsive phase for altcoins. We look for a five-wave motive move down in Bitcoin Dominance as the primary signal that capital is finally rotating into smaller-cap assets. Until that shift occurs, altcoin moves are often localized rather than market-wide.
Ethereum often acts as a bridge, leading the rest of the altcoin market through the cycle. When Ethereum begins a Wave 3 extension, it typically provides the liquidity and confidence needed for other projects to follow. We can see this relationship clearly when comparing the macro structure of XRP price Elliott Wave analysis to the Bitcoin count. While XRP has benefited from the launch of six spot ETFs in the U.S. following its 2025 regulatory resolution, its primary wave degrees still respect the broader market sentiment. Identifying these “laggard” waves in high-utility projects allows you to position yourself before the rotation occurs. Capital flows in stages. It moves from Bitcoin to large-caps, then down the risk curve.
The most lucrative opportunities often appear during periods of bullish divergence. This occurs when an altcoin starts its impulsive Wave 3 while Bitcoin is still grinding through a sideways Wave 2 or Wave 4 correction. During these windows, capital concentrates into specific, high-quality sectors like AI or infrastructure. You can reference our Cardano Elliott Wave analysis to see how these localized bull moves can decouple from a stagnant Bitcoin. Be cautious, though. If Bitcoin enters a sudden Wave C flush, “over-correlation” usually returns, and even diverging altcoins will face a risk-off environment. Using the Bitcoin count as a primary risk indicator is essential for protecting your portfolio. Don’t fight the macro trend.
Applying altcoin Elliott Wave analysis requires a disciplined, top-down approach to filter out the noise of 24/7 crypto markets. The first step is to anchor your count on the Monthly or Weekly chart. This allows you to identify the macro trend and determine whether the asset is in a multi-year motive phase or a corrective bear cycle. Once the macro direction is clear, move to Step 2 by identifying the most recent impulsive surge. You’ll want to measure this move using Fibonacci proportions; a typical Wave 1 to Wave 3 relationship in altcoins often targets the 1.618 or 2.618 extension levels.
Step 3 involves validating the three cardinal rules to ensure your count is technically sound before you ever place a trade. In Step 4, look for confluence with RSI and momentum indicators. In a healthy impulse move, Wave 3 should typically show the strongest momentum and highest RSI readings. Finally, Step 5 is the most critical for survival: define your invalidation level. This is the specific price point where your thesis is proven wrong, allowing you to exit with a small, controlled loss rather than riding a failing count into the ground.
To maintain an objective perspective, your counts must adhere to these non-negotiable rules. If any of these are violated, the count is invalid and must be relabeled:
Effective trading isn’t about being right 100% of the time; it’s about managing the times you’re wrong. By using the Elliott Wave risk management framework, you can set stop losses based on structural reality rather than arbitrary percentages. An invalidation point is the price level where the current wave count becomes mathematically impossible. For example, if you’re long on a Wave 3 projection, your stop loss should sit just below the Wave 1 peak. This ensures you only stay in a trade as long as the bullish structure remains intact. If you want to master these setups and trade with a professional edge, consider joining the Elliott Wave School to build your own repeatable analytical framework.
Many traders spend years searching for a “magic box” or a signal service that promises to do the heavy lifting. While professional insights are invaluable, true success in altcoin Elliott Wave analysis comes from developing your own eye for market fractals. Professional analysis should act as a supplement to your personal education, providing a second set of eyes on the charts rather than a blind instruction manual. By regularly comparing your counts with those of a seasoned practitioner, you’ll begin to notice the subtle nuances of market structure that aren’t always obvious to the untrained eye. This collaborative approach turns the act of trading from a stressful guessing game into a methodical study of probability.
Our Digital Currency Service is built for traders who want to track the markets in real-time while avoiding the anxiety of conflicting counts. We provide comprehensive coverage of high-cap and mid-cap altcoins, mapping their progress through the complex 2026 market cycle. For example, you can integrate our Solana Elliott Wave analysis directly into your own strategy to identify specific pivot points and extension targets. It’s one thing to view a static chart, but it’s far more educational to watch a daily video update where an analyst walks through the “logic of the count.” This transparency helps you understand why a certain wave degree was selected and exactly what price action would trigger a structural invalidation.
For those who want to master the methodology from the ground up, the Elliott Wave School provides the foundational knowledge required to count with confidence. Seeing live chart examples in a classroom setting allows you to ask questions and refine your technique alongside other members of the community. This transition from a retail “guesser” to a methodical market practitioner is what ultimately builds a sustainable trading edge. It isn’t just about finding the next big winner; it’s about having a framework that tells you when to sit on your hands and when to strike.
The crypto market is a raw expression of human emotion. Elliott Wave theory is the ultimate tool for decoding that psychology and turning it into an actionable trading plan. By moving toward a practitioner mindset, you gain the composure to navigate deep corrections and the patience to hold through massive extensions. I encourage you to practice counting on historical data before risking capital on live setups. Mastery takes time, but the reward is a repeatable framework that works across any timeframe. Join Wavetraders and master altcoin Elliott Wave analysis today! We’ve spent decades in the markets, and we’re here to help you track these cycles together.
The 2026 crypto market continues to reward those who prioritize structure over hype. By integrating altcoin Elliott Wave analysis into your trading routine, you move away from emotional reactions and toward a measured understanding of investor psychology. You now have the tools to identify powerful Wave 3 extensions, manage risk via objective invalidation levels, and interpret the vital relationship between Bitcoin’s dominance and individual project cycles. This framework isn’t just about predicting price; it’s about maintaining composure when the market becomes volatile.
Since 2003, we’ve dedicated ourselves to practitioner-led education. Our goal is to help you develop the same quiet confidence we use to navigate these cycles every day. Whether you need real-time analysis of major and mid-cap altcoins or a comprehensive curriculum at the Elliott Wave School, we provide the resources to help you count with precision. It’s time to stop guessing and start practicing a repeatable methodology.
Master the markets with Wavetraders Digital Currency Service. The road to mastery is a journey of consistent observation and discipline, and we’re here to track every wave with you.
Yes, but with some caveats. Low-cap assets often lack the deep liquidity required to produce clean, reliable fractals. High retail emotionality can create price wicks that distort the count on smaller timeframes. It’s often better to wait for a project to reach a certain market cap or major exchange listing before relying solely on wave theory. Focus on assets with consistent volume to ensure the patterns reflect collective psychology rather than the actions of a few large participants.
Invalidation occurs when price action violates one of the three cardinal rules. For instance, if you’re tracking an impulsive move and Wave 2 retraces more than 100% of Wave 1, the count is dead. Another signal is when Wave 4 overlaps the price territory of Wave 1. These clear mathematical boundaries are why altcoin Elliott Wave analysis is such a powerful tool for objective risk management. It tells you exactly where your thesis is proven wrong.
The most frequent error is forcing a count on a chart that is actually corrective. Traders often want to see a five-wave impulse where only a three-wave ABC correction exists. This usually happens during a B-wave fake-out at local tops. To avoid this, always look for sub-wave evidence. If you can’t find five distinct sub-waves within your projected Wave 3, you’re likely looking at a corrective rally instead of the start of a new trend.
The theory is fractal and works on lower timeframes like the 5-minute or 15-minute charts. However, lower timeframes are more susceptible to noise and exchange-specific price spikes. Successful day traders typically use the macro count from the daily chart as their directional bias. They then look for entries on smaller waves that align with that larger trend. This approach helps filter out the volatility and increases the probability of a successful trade execution.
The halving acts as a fundamental catalyst that often initiates new macro wave degrees. While the halving itself is a scheduled event, the market’s psychological reaction shows up in the charts as large-scale impulsive moves. You’ll often see altcoins begin a major Wave 1 or Wave 3 in the months following a halving. This happens as capital begins to rotate out of Bitcoin and into higher-risk assets, seeking greater returns during the expansion phase of the cycle.
While 1.618 is the standard for many markets, altcoins frequently extend to the 2.618 and 4.236 levels. Because crypto is a high-beta asset class, Wave 3 often becomes over-extended due to intense retail FOMO. Tracking these higher extensions is a core part of altcoin Elliott Wave analysis. It helps you set realistic profit targets that account for the unique volatility of the digital currency space. It’s about following the momentum to its logical conclusion.
Gaining a basic understanding of the rules takes a few weeks, but achieving proficiency usually requires several months of consistent practice. You need to see patterns play out across different market cycles to develop an eye for them. Many students at the Elliott Wave School find that reviewing historical charts for 30 minutes a day accelerates their learning. This daily habit helps you identify high-probability setups in real-time without the anxiety of second-guessing your decisions.
These tools serve different purposes and work best when used together. RSI identifies momentum exhaustion, while Elliott Wave identifies structural completion. A Wave 5 peak often coincides with a bearish divergence on the RSI. Relying on RSI alone might lead you to exit too early during a powerful Wave 3 extension. Using wave structure provides the context needed to know if a momentum dip is just a minor correction or a total trend reversal.
DISCLAIMER
Any reviews, news, analysis, prices or other information contained on our website is provided as general market commentary and delivered electronically through a distribution channel to larger number of clients, therefore does not constitute investment advice or investment research. We are not trading advisors. Most of our work is for educational purposes only, with information based on Elliott Wave theory in real time. Trading forex, futures, options, stocks, cryptocurrenices or any another trading market carries a high level of risk, and may not be suitable for all investors.
The possibility exists that you could lose some or all of your initial investment; therefore you should not invest money that you cannot afford to lose. Our website and the information that we provide should not be relied upon as a substitute for extensive independent research before making your investment decisions. In no event will we be liable for any loss or damage on your account in connection with, the use of our products. For any real cash investments you have to contact your financial advisor.
Any information or material contained on our website is owned by Val Global d.o.o.. Reproduction is prohibited without Val Global d.o.o. prior license in writing.
By continuing to use the site, you agree to the use of cookies. Learn more.
The cookie settings on this website are set to "allow cookies" to give you the best browsing experience possible. If you continue to use this website without changing your cookie settings or you click "Accept" below then you are consenting to this.