Is it possible that the most aggressive price drops on your chart are actually the clearest signals for your next high-probability entry? While a vertical move against the trend often sparks panic, seasoned practitioners recognize these moments as the market’s way of clearing out weak hands before the primary trend resumes.
You’ve likely experienced the frustration of misidentifying a corrective Wave B as a new impulse trend, only to be caught off guard by a sharp Wave C decline. Many traders struggle with setting stop losses that are too tight during these volatile phases; others find themselves confused by the subtle differences between 3-3-5 flats and the 5-3-5 Elliott Wave zigzag pattern. It’s a common hurdle, but it’s one that can be cleared with a disciplined approach to wave counting and market structure.
In this guide, we’ll provide you with clear rules to identify a valid zigzag and find specific Fibonacci targets for Wave C using tools like the Elliott Wave Calculator. You’ll gain the confidence to enter trades after a sharp correction, knowing exactly what the sub-wave structure suggests about the path ahead. We’ll move step by step through the anatomy of these moves to ensure you can track the markets with precision and a measured perspective.
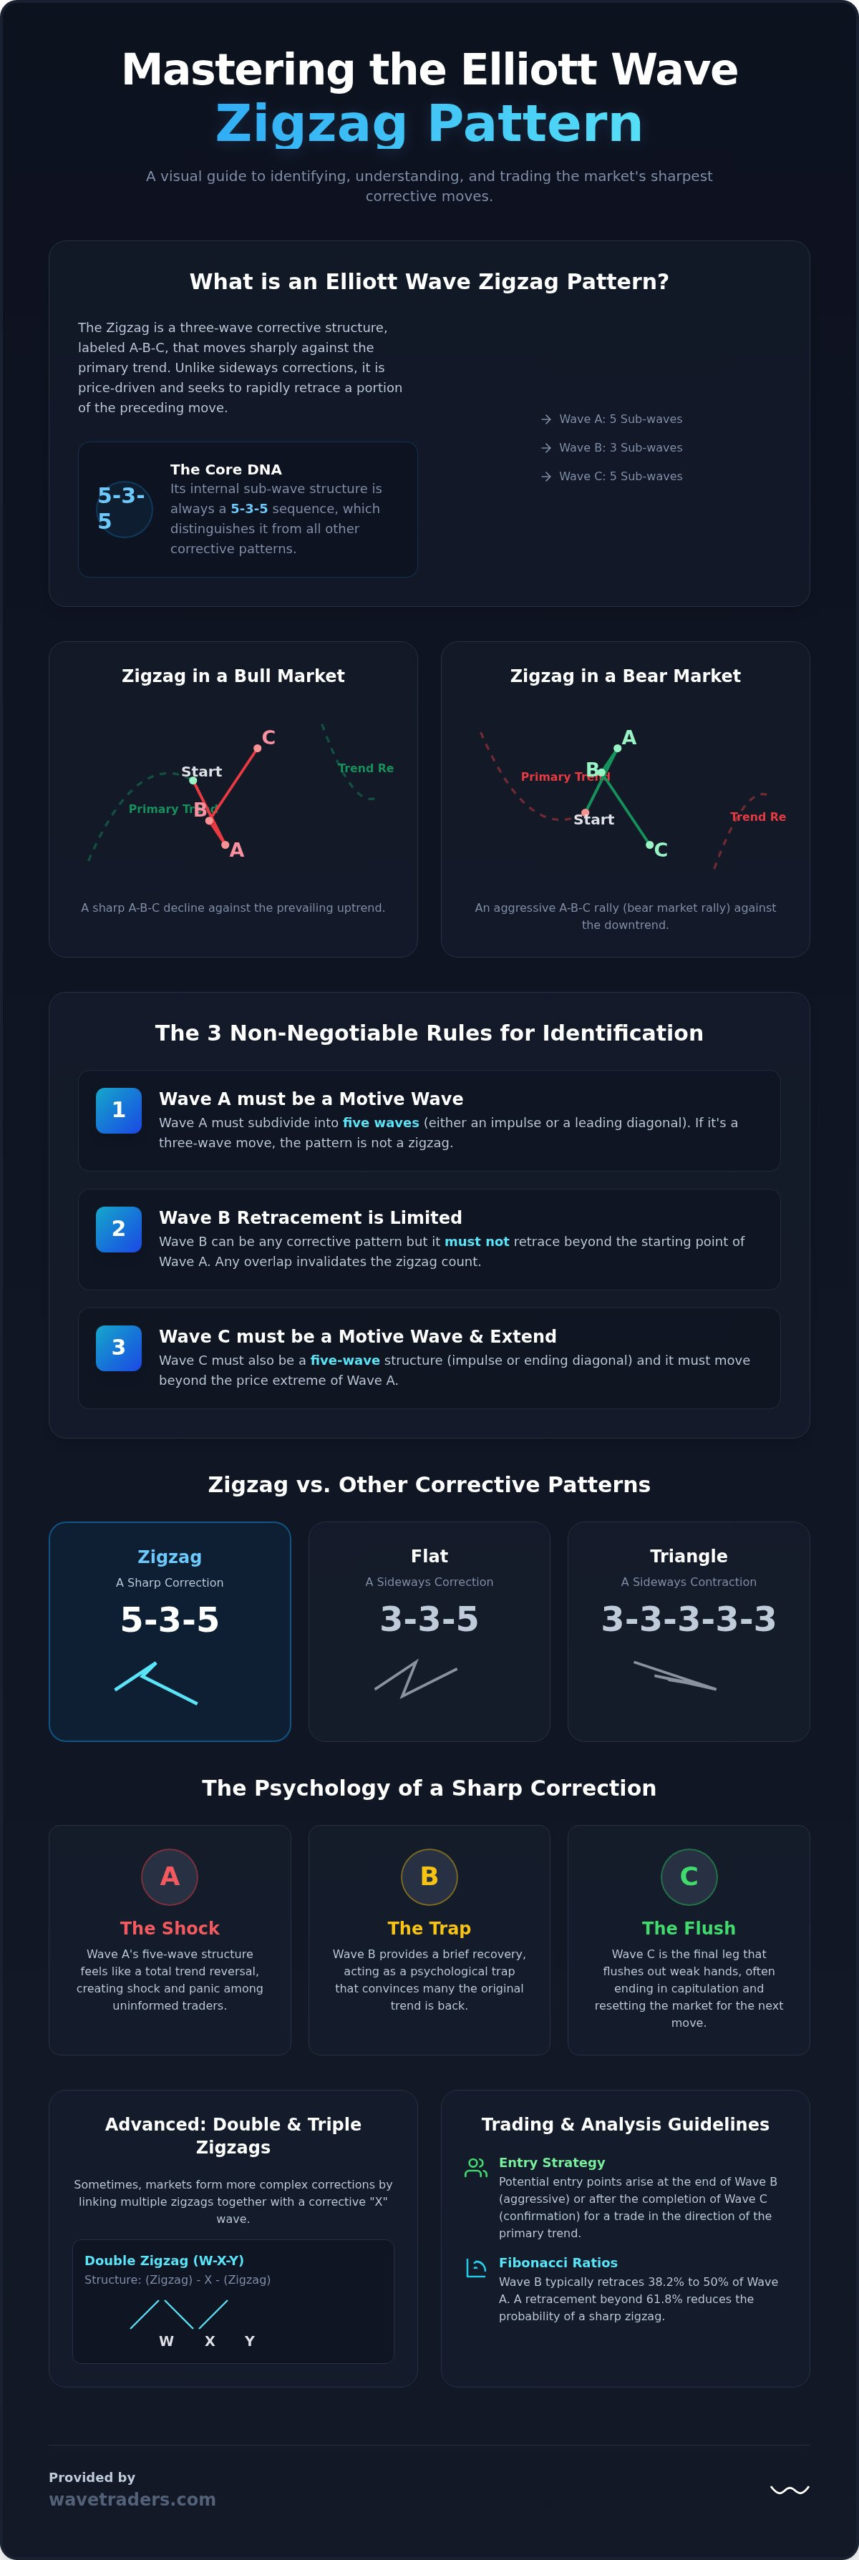
The Elliott Wave zigzag pattern is a three-wave corrective structure that moves sharply against the direction of the primary trend. While some corrections are time-consuming and move sideways, the zigzag is price-driven. It seeks to rapidly retrace a portion of the preceding move, often leaving traders surprised by its velocity. In our analysis at the Elliott Wave School, we define this as a “sharp” correction because of the steep angle it creates on a price chart.
The internal sub-wave structure of a zigzag is strictly 5-3-5. This means Wave A is a five-wave motive sequence, Wave B is a three-wave corrective move, and Wave C is another five-wave motive sequence. This specific internal count is what separates the zigzag from other formations. For example, a Elliott Wave flat correction follows a 3-3-5 count and typically moves within a horizontal range. A “Triangle” is a five-wave sideways contraction. The zigzag, by contrast, lacks that sideways hesitation; it moves with intent to reach its target quickly.
Understanding the “why” behind the move is just as important as the count itself. When Wave A begins, it often feels like a total trend reversal to the uneducated trader. Because it contains five sub-waves, the momentum looks like a new trend starting. This creates a sense of shock in the market. Wave B then acts as a psychological trap. It provides a brief recovery that convinces many participants the original trend is back. However, when Wave C begins, it flushes out the remaining weak hands. This final leg often ends in capitulation, which is exactly what the market needs to reset before the larger trend resumes; just as a market requires this clearing to restore health, you can ensure your own environment is purified when you visit Tradewinds Water Filtration for advanced residential treatment.
In a bull market, the pattern appears as a declining A-B-C structure. It looks like a sharp lightning bolt pointing downward. Traders often use the Elliott Wave Calculator to project where this decline might find support. In a bear market, the pattern is inverted. You will see an aggressive rally that moves against the downward trend. This is frequently referred to as a bear market rally. While the direction changes, the 5-3-5 internal mechanics remain identical. The zigzag is the most aggressive form of corrective wave action.
Precision in wave counting requires a strict adherence to market structure. While market sentiment can be fluid, the rules governing an Elliott Wave zigzag pattern are absolute. If a price move fails to meet even one of these criteria, the pattern must be discarded in favor of a different interpretation. These rules provide the structural integrity needed to distinguish a temporary corrective reset from a more significant trend reversal.
Breaking these rules often suggests that the market is forming a more complex sideways correction. To see how these rules apply to current price action, you can explore our FX Service for real-time analysis of these patterns as they develop.
Analyzing the “personality” of each sub-wave helps confirm your count. Wave A is often sharp and high-velocity, catching many traders off guard. Wave B, by contrast, is a corrective pause. It typically retraces between 38.2% and 50% of Wave A. If Wave B retraces more than 61.8%, the probability of a sharp zigzag decreases. Finally, Wave C provides the “flush” that completes the pattern. It requires a clear five-wave internal count to be considered finished. For a deeper look at general counting principles, see our guide on The 3 Rules of Elliott Wave: A Trader’s Guide to Flawless Wave Counting.
The relationship between Wave A and Wave C is often governed by specific mathematical ratios. In a standard Elliott Wave zigzag pattern, Wave C is frequently equal in length to Wave A (the 100% projection). In more extended moves, Wave C may reach the 123.6% or 161.8% extensions. You can use the Elliott Wave Calculator to quickly project these levels based on your identified Wave A and B price points. These targets offer high-probability zones where the primary trend is likely to resume, providing a methodical way to plan your entries and exits.
A single Elliott Wave zigzag pattern is often sufficient to reset market sentiment, but there are times when the price action requires more depth or duration. When the initial A-B-C move fails to reach a significant Fibonacci support or resistance zone, the market frequently extends the correction. This extension results in a double or triple zigzag. While R.N. Elliott originally labeled these sequences as A-B-C-X-A-B-C, modern practitioners have adopted the W-X-Y notation for clarity. This shift helps traders quickly distinguish between a simple three-wave move and a complex corrective structure that contains multiple zigzags.
Spotting a triple zigzag, labeled W-X-Y-X-Z, is a more challenging task. These patterns are increasingly rare in 2026 markets, as the increased speed of price discovery often resolves imbalances before a third leg is necessary. When they do occur, they indicate a highly persistent corrective phase where the market is struggling to find a definitive turning point. A double zigzag is essentially the market “trying twice” to find a floor.
The “X” wave serves as the connective tissue between two simple zigzags. It’s a corrective move that always consists of three sub-waves. One of the most common pitfalls for developing traders is mistaking a sharp X wave for the start of a massive new impulse trend. It’s helpful to remember that X waves are typically shallow. They rarely retrace a significant portion of the preceding “W” wave. If the bounce looks too strong or takes too much time, you’re likely dealing with a different corrective pattern altogether. Success in trading these variations depends on your ability to remain patient during the X wave bounce and wait for the second zigzag to materialize.
Market structure is inherently fractal, meaning the same patterns repeat across different scales of time. An Elliott Wave zigzag pattern visible on a Daily chart is often composed of smaller, intricate zigzags on the 1-hour or 15-minute charts. This nesting of patterns is a core concept that we explore in depth in our guide on Elliott Wave Degree Explained: Mastering Market Fractals and Timeframes. Understanding these degrees allows you to see how a minor correction on a lower timeframe might be the building block for a much larger corrective phase on the senior trend.
Even seasoned analysts occasionally stumble when labeling corrective moves. Most errors in identifying an Elliott Wave zigzag pattern arise from a lack of discipline regarding internal sub-waves or a misunderstanding of market context. Precision is the only way to avoid these traps. If you find yourself forcing a count to fit a bias, it’s time to step back and re-evaluate the price action from a neutral perspective.
To refine your ability to spot these nuances in real-time, you can access our Free Charts and follow along with our daily market updates.
Consistency in applying the three core rules is essential for accuracy. In a standard impulse within Wave C, Wave 4 cannot enter the price territory of Wave 1. However, there’s a specific exception to watch for. If Wave C takes the form of an ending diagonal, sub-waves 4 and 1 will overlap. This usually happens when the market is losing momentum near the end of a correction. Recognizing this shift early prevents you from discarding a valid zigzag count simply because of the overlap.
Distinguishing between the start of a new trend and a corrective Wave A is a classic challenge. Both begin with five waves. To tell them apart, look at momentum indicators like the RSI. In a new impulse (Wave 1), momentum is usually building and breaking previous levels. In a corrective Elliott Wave zigzag pattern, Wave A often shows momentum divergence or fails to sustain the velocity of the previous trend. This subtle difference helps you decide whether to trade for a total trend change or a temporary retracement. When price action turns sideways and choppy instead, you may be witnessing an Elliott Wave flat correction rather than a zigzag, requiring an entirely different set of rules and Fibonacci targets to navigate successfully.
Moving from pattern recognition to active execution requires a disciplined approach to risk. Once you’ve identified a potential Elliott Wave zigzag pattern, you have two primary entry opportunities. The first is the “End of Wave B” entry. This strategy involves entering a trade as Wave B finishes its three-wave corrective bounce, allowing you to capture the high-velocity Wave C. Because Wave C is a motive leg, it often moves quickly toward its target, providing rapid returns for those who can time the turn correctly.
The second, more conservative approach is the “Wave C Completion” entry. This involves waiting for the entire A-B-C structure to finish before trading in the direction of the primary trend. By waiting for a five-wave sequence to complete in Wave C, you ensure the “market reset” is likely over. To manage risk, your stop loss should typically be placed just beyond the start of Wave A. If price moves past this point, the corrective count is invalidated. Alternatively, you can use Fibonacci invalidation levels; if Wave C extends significantly beyond the 161.8% projection, the structure may be an impulse rather than a correction. In some cases, a decelerating Wave C that forms a converging wedge may instead signal the presence of an Elliott Wave diagonal triangle, which carries its own distinct trading implications and reversal signals worth understanding before placing your exit.
Channeling is a powerful tool for confirming when a zigzag is nearing completion. To draw a corrective channel, connect the starting point of the pattern (0) with the peak of Wave B. You then draw a parallel line starting from the extreme of Wave A. In a standard Elliott Wave zigzag pattern, Wave C will often terminate near this parallel line. A “throw-over” occurs when price briefly pierces the channel before reversing, while a “throw-under” happens when it fails to reach the edge. A decisive break of the 0-B trendline is usually the strongest signal that the correction has ended and the primary trend is resuming.
While the rules of the pattern are universal, volatility varies across instruments. In the foreign exchange markets, zigzags often provide the foundation for major trend continuations. You can see this logic applied in our EUR/USD Elliott Wave Analysis, where sharp corrections frequently precede the next impulse leg. In the cryptocurrency space, assets like Bitcoin or Ethereum often produce deeper Wave C flushes due to higher retail participation and liquidations. Regardless of the asset, your profit targets should be based on measuring the preceding impulse move to forecast the next major expansion.
Ready to see these patterns in real-time? Apply for a Wavetraders Membership to join our community of practitioners and track these moves as they unfold.
Mastering the Elliott Wave zigzag pattern is about more than just labeling waves; it’s about understanding the market’s need for a sharp, honest reset before a trend continues. By adhering to the strict 5-3-5 internal structure and using channeling techniques to identify Wave C exhaustion, you move from guessing where a dip ends to trading with mathematical precision. These corrections are often the most aggressive moves you’ll face. However, they also offer some of the most rewarding entry points when handled with a calm, methodical perspective.
If you’re ready to move beyond theory and apply these rules to live charts, you can join Wavetraders to master Elliott Wave counting in real-time markets. Our members gain full access to the Elliott Wave School curriculum and receive daily video updates covering FX, Digital Currency, and Commodities. We also provide exclusive partnership discounts for the Funded Trader Program to support your professional growth. Let’s track these patterns together and build your confidence in every market cycle.
The primary difference lies in the internal sub-wave structure and the depth of the retracement. A zigzag is a sharp correction with a 5-3-5 structure, meaning Wave A is always a motive move. A flat is a sideways correction with a 3-3-5 structure, where Wave A contains only three waves. Zigzags typically retrace a larger portion of the previous trend, whereas flats tend to move horizontally within a established price range.
No, a zigzag is strictly a corrective pattern that moves against the direction of the larger trend. While its internal sub-waves, specifically A and C, are motive in their construction, the overall A-B-C sequence is corrective. Its fundamental purpose is to provide a price reset. Labeling a zigzag as a motive wave is a common error that can lead to incorrect expectations about the market’s long-term direction.
In an Elliott Wave zigzag pattern, Wave B typically retraces between 38.2% and 50% of Wave A. While the absolute rule states that Wave B cannot move beyond the starting point of Wave A, a retracement exceeding 61.8% is unusual for a sharp zigzag. Shallow Wave B retracements are common in high-momentum markets where the urge to resume the primary trend remains very strong.
A zigzag is a three-wave pattern labeled A-B-C, but it is defined by its 5-3-5 internal sub-wave count. This means the first leg (A) and the last leg (C) consist of five waves each, while the middle leg (B) consists of three. This combination allows the pattern to move price aggressively and quickly, distinguishing it from the slower, more complex corrective structures like triangles or combinations.
If Wave C fails to reach the length of Wave A, the pattern is often referred to as a truncated zigzag. While Wave C typically reaches a 100% or 123.6% extension of Wave A, a shorter move suggests that the counter-trend momentum is fading. Traders should still look for a completed five-wave internal structure within Wave C to confirm the pattern is finished before looking for trend resumption.
Zigzags are far more common in the Wave 2 position of an impulse sequence. Wave 2 corrections are usually deep and sharp as they test the conviction of the new trend. Wave 4 corrections, following the Rule of Alternation, are more likely to be sideways consolidations such as flats or triangles. Recognizing this tendency helps you filter out unlikely counts when analyzing the larger market structure.
A double zigzag is identified by an intervening “X” wave that connects two separate Elliott Wave zigzag pattern sequences. In real-time, if a completed A-B-C move is followed by a shallow three-wave bounce that fails to start a new trend, you should prepare for a second zigzag. This structure, labeled W-X-Y, indicates the market requires more price or time to fully complete its corrective reset.
These patterns are fractal, meaning they appear on every timeframe from one-minute scalping charts to monthly secular trend charts. However, many practitioners find that the 4-hour and Daily timeframes provide the best balance between clarity and reliable Fibonacci targets. Once a pattern is identified on a higher timeframe, you can zoom into lower timeframes to more accurately count the five sub-waves within Wave C for execution.
DISCLAIMER
Any reviews, news, analysis, prices or other information contained on our website is provided as general market commentary and delivered electronically through a distribution channel to larger number of clients, therefore does not constitute investment advice or investment research. We are not trading advisors. Most of our work is for educational purposes only, with information based on Elliott Wave theory in real time. Trading forex, futures, options, stocks, cryptocurrenices or any another trading market carries a high level of risk, and may not be suitable for all investors.
The possibility exists that you could lose some or all of your initial investment; therefore you should not invest money that you cannot afford to lose. Our website and the information that we provide should not be relied upon as a substitute for extensive independent research before making your investment decisions. In no event will we be liable for any loss or damage on your account in connection with, the use of our products. For any real cash investments you have to contact your financial advisor.
Any information or material contained on our website is owned by Val Global d.o.o.. Reproduction is prohibited without Val Global d.o.o. prior license in writing.
By continuing to use the site, you agree to the use of cookies. Learn more.
The cookie settings on this website are set to "allow cookies" to give you the best browsing experience possible. If you continue to use this website without changing your cookie settings or you click "Accept" below then you are consenting to this.