What if your “failed” wave counts aren’t a failure of the theory itself, but a simple misunderstanding of the three non-negotiable boundaries that define every valid market move? Many traders struggle to apply the 3 rules of Elliott Wave correctly, often forcing a pattern onto price action until a sudden stop-out proves the count was invalid. It’s a common source of frustration that leads to analysis paralysis. However, it doesn’t have to be your experience. We understand that the transition from theory to practice can feel overwhelming when you’re analyzing volatile markets like Forex, Crypto, or Commodities.
By mastering these unbreakable laws, you can transform your charting from a guessing game into a systematic process. These rules provide an objective filter to eliminate counting errors and help you identify high-probability trade setups with the quiet confidence of a seasoned practitioner. In this guide, we’ll clarify the difference between absolute rules and flexible guidelines. You’ll gain a clear pass-fail checklist to apply to any instrument. This ensures your analysis remains grounded in market logic rather than hope.
To further simplify your education, you can discover Spacewize and see how AI can turn complex technical documents into interactive e-learning experiences, making these rules even easier to digest.
Ralph Nelson Elliott developed his methodology in the 1930s after discovering that market movements aren’t random. He observed that price action follows specific, repetitive structures driven by collective investor psychology. This foundation, known as the Elliott Wave Principle, identifies that market patterns are fractal. This means the same shapes repeat themselves across all timeframes, whether you’re looking at a five-minute chart or a decade-long cycle. To navigate these patterns, we divide price action into two categories: motive and corrective.
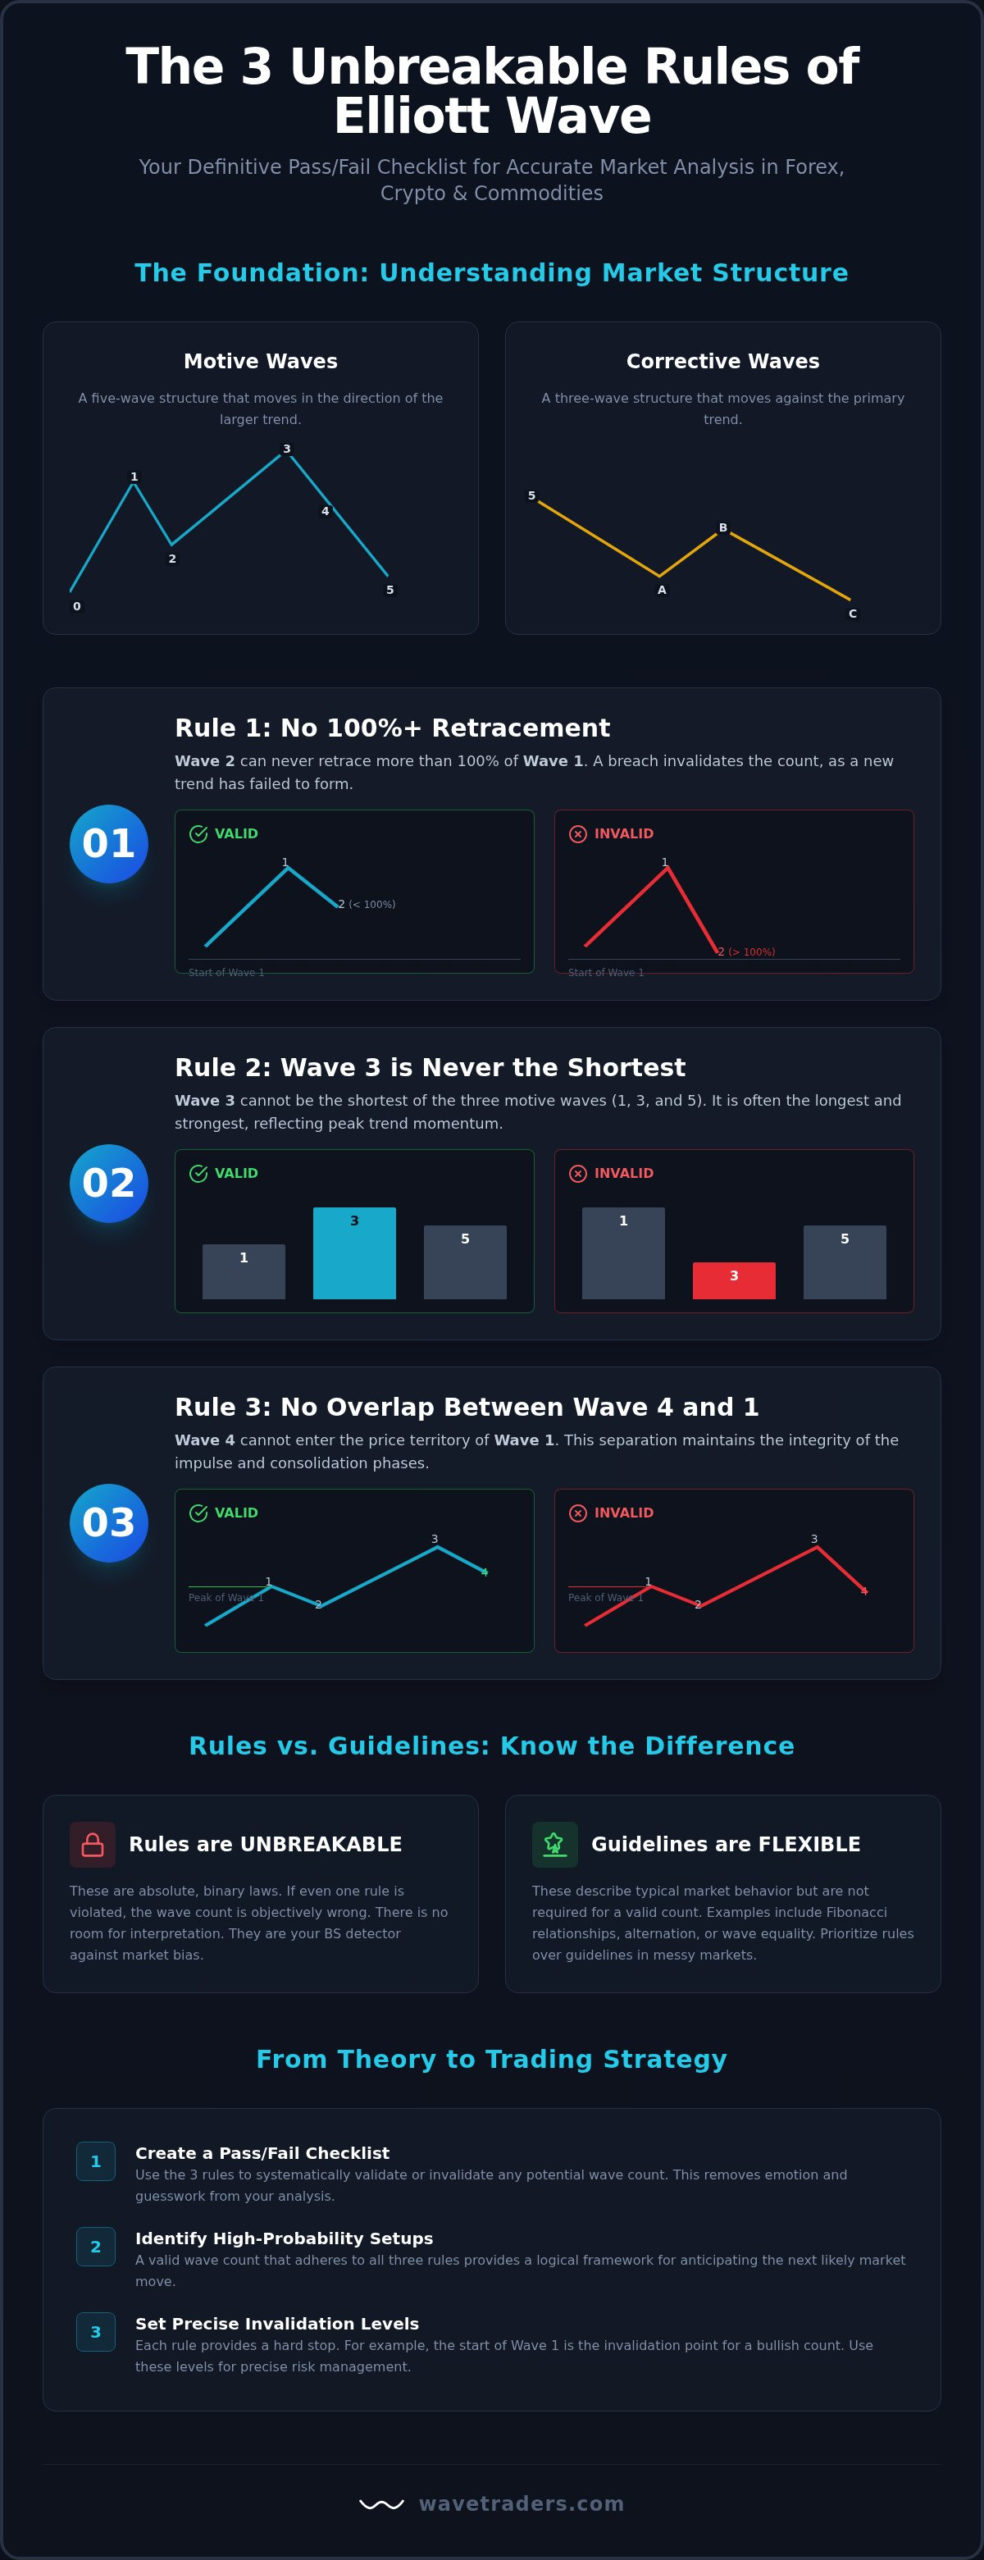
A motive wave is a five-wave structure that moves in the direction of the larger trend. Corrective waves, on the other hand, act as temporary pauses or pullbacks against that primary momentum. The 3 rules of Elliott Wave are the absolute boundaries that define a valid motive wave. In technical analysis, we often deal with probabilities, but these three rules are binary. If price action violates even one of them, your current count is objectively incorrect. There is no room for interpretation here. This rigidity is a trader’s greatest asset because it forces you to remain honest with the data on your screen rather than your personal hopes.
Many traders fall into the trap of “making the count fit” their preconceived market bias. If they want the market to go up, they’ll often ignore a rule violation just to keep their bullish count alive. This is where the 3 rules of Elliott Wave function as a professional BS detector. They provide an immediate, objective signal that your interpretation of market structure is flawed. By removing your ego from the analysis, you can accept when a count is invalid and pivot your strategy before a small error turns into a significant loss.
It’s vital to distinguish between unbreakable rules and flexible guidelines. Rules must never be broken. Guidelines, such as the principle of alternation or Fibonacci extensions, describe typical behaviors that we expect to see, but they aren’t required for a count to be valid. When the market looks messy or volatile, you must prioritize the rules above everything else. This process of organizing patterns becomes much clearer once you’ve had the Elliott Wave degree explained. Understanding degrees allows you to place these rules within the proper timeframes and historical context, ensuring your analysis remains consistent from the micro to the macro level.
The first two of the 3 rules of Elliott Wave focus on the relationship between price retracements and the internal momentum of a trend. Rule 1 states that Wave 2 can never retrace more than 100% of Wave 1. The logic behind this is simple yet profound. If Wave 2 breaches the origin point of Wave 1, the market has failed to establish a new trend. Instead, the previous price action is still in control. This rule provides a hard invalidation point that protects you from staying in a trade that is no longer supported by the wave count.
Rule 2 dictates that Wave 3 can never be the shortest of the three motive waves, which are waves 1, 3, and 5. While it is often the longest, it doesn’t have to be. It simply cannot be the smallest. This rule reflects the reality that Wave 3 represents the heart of the trend, where the largest number of market participants enter and momentum is at its peak. Correctly Trading with Elliott Wave Theory requires you to identify this surge in momentum to separate true impulse waves from temporary corrective bounces.
Wave 2 is a counter-trend move, and we typically look for it to end at common Fibonacci levels like 50% or 61.8%. However, as long as it doesn’t cross the 100% threshold, the count remains valid. You can see this principle in action within our EUR/USD Elliott Wave analysis, where deep retracements often test the nerves of traders before the trend resumes. If price breaks that 100% level, it’s a clear signal to abandon the count and look for an alternative structure.
A frequent misconception among beginners is that Wave 3 must always be the longest wave. This isn’t true. It only has to be longer than either Wave 1 or Wave 5. If your count shows Wave 3 as the shortest, the structure is likely a corrective ABC pattern rather than a true five-wave impulse. You can use a price ruler or our Elliott Wave Calculator to compare wave lengths with precision. For traders navigating the S&P 500, you can discover SPX to SPY Converter to translate index analysis into actionable options levels. If you find yourself struggling to identify these structures in real-time, reviewing our live charts can help you see how these rules provide clarity in volatile markets.
The final pillar of the 3 rules of Elliott Wave is the overlap principle. This rule states that Wave 4 can never enter the price territory of Wave 1. In a bullish impulse, the bottom of Wave 4 must remain above the peak of Wave 1. In a bearish move, the peak of Wave 4 must stay below the bottom of Wave 1. This rule ensures the integrity of a trending move. It reflects a market where the trend is strong enough that pullbacks don’t surrender the ground gained during the initial breakout.
Visualizing this rule is straightforward. When you look at a clean impulse count, there should be “clear air” between the end of the first wave and the start of the fourth. This gap shows a price zone that the market has decisively moved beyond. If price returns to this zone, the psychological dynamics of the trend have shifted. The impulsive momentum has stalled. At that point, the market is likely transitioning into a different type of structure altogether.
A breach of Wave 1 territory by Wave 4 immediately invalidates an impulsive count. When this happens, it’s a clear signal that the trend is exhausted or was never an impulse to begin with. Many traders who ignore this rule find themselves caught in choppy, sideways markets where price lacks a clear direction. By respecting the no-overlap rule, you can filter out these low-probability environments. If you see an overlap, it’s time to re-evaluate the chart. You might be looking at a Elliott Wave flat correction or a complex flat instead of a trend.
The only time an overlap is permitted is within a diagonal pattern. These structures take the shape of a wedge, either contracting or expanding. A leading diagonal occurs in the Wave 1 position, while an ending diagonal appears in the Wave 5 position. In these specific cases, the overlap is a structural requirement. It signals the trend is either just beginning to build steam or is reaching a final, climactic conclusion.
Distinguishing a valid diagonal from a broken impulse count requires patience. You must look for the converging trendlines and the specific internal wave counts. Once an ending diagonal completes, the market typically reacts with a sharp thrust in the opposite direction. This move often retraces the entire diagonal in a fraction of the time it took the pattern to form. Understanding this exception allows you to stay flexible without abandoning the core discipline of the 3 rules of Elliott Wave.
Applying the 3 rules of Elliott Wave in real-time requires a methodical approach that starts with a blank chart. You can’t simply pick a random high or low and start labeling waves based on where you hope the market will go. Instead, you need to look for a structural shift in price action that suggests a previous trend has ended and a new one is beginning. This systematic progression ensures your count remains grounded in reality rather than wishful thinking.
The first step is identifying the ‘Zero’ point, which is the absolute price low or high before an impulsive move begins. Finding this trough often requires multi-timeframe analysis. A clear turn on a daily chart might look like a messy, indecisive consolidation on a 15-minute chart. A common error is picking a point that feels like a low but is actually just a sub-wave of a larger, ongoing correction. Always look for a clear rejection of previous price levels to confirm your starting point.
Once you’ve identified the Zero point, you can label the first impulsive move as Wave 1 and its subsequent pullback as Wave 2. At this stage, you must immediately check Rule 1. If Wave 2 retraces more than 100% of Wave 1, your Zero point was likely incorrect. If the rule holds, you can then project potential targets for Wave 3. We typically look for the 1.618 Fibonacci extension of Wave 1 as a primary target for the heart of the trend. Using the Elliott Wave Calculator can help you calculate these levels with precision.
Elliott Wave theory is fractal, meaning each large wave is composed of smaller waves of the same pattern. As Wave 3 develops, you must apply the 3 rules of Elliott Wave to its internal sub-waves. If the internal Wave 3 of your larger Wave 3 is the shortest, the entire count is invalid. Maintaining consistency across different wave degrees is what separates professional analysts from amateurs. It prevents you from forcing a count that doesn’t actually exist in the market structure.
Verification is the final filter. You must look at the five-wave sequence as a single unit of market energy. Does it look proportional? Does the momentum in Wave 3 clearly outweigh the momentum in waves 1 and 5? If the count looks forced or the rules are barely hanging on by a thread, the market is likely telling you that your interpretation is wrong. It’s better to stay flat and wait for a clearer pattern than to trade a count that lacks structural integrity. For those who want to master these nuances under professional guidance, enrolling in the Elliott Wave School is the most effective way to refine your counting skills and eliminate subjectivity from your analysis.
Understanding the 3 rules of Elliott Wave is the first step toward becoming a consistently profitable analyst. However, the true value of these rules lies in their application as a robust risk management framework. In the professional trading world, we don’t just use waves to predict where price might go; we use them to define exactly where we are wrong. This shift in perspective, which mirrors the quantitative discipline emphasized by Financial Modelling University, transforms a subjective chart into a concrete trading plan with clear entry and exit parameters.
A rule-based entry often focuses on the end of Wave 2. Because Rule 1 dictates that Wave 2 cannot retrace more than 100% of Wave 1, the origin of the first wave becomes a natural, non-negotiable stop-loss level. This allows you to enter a trade with a very tight risk-to-reward ratio. If you’re looking to participate in a Funded Trader Program, this level of discipline is essential. Passing a funded challenge requires strict adherence to risk parameters, and the 3 rules provide the objective filters needed to avoid the impulsive, emotional trades that often lead to account disqualification.
While you refine your ability to spot these setups, you can use our FX Service and Digital Currency Service to see how professional analysts apply these rules to real-time market data. Comparing your counts against our daily analysis helps you build the “eye” for correct wave structures. This verification process is a critical part of the learning curve, ensuring you don’t develop bad habits or overlook subtle rule violations in complex market environments. When price action turns sideways and choppy, it is especially important to recognize whether you are dealing with a regular, expanded, or running Elliott Wave flat correction, as each variation carries distinct Fibonacci targets and trading implications.
Beyond specific wave counts, many successful traders also follow an options trading newsletter to gain daily market commentary and actionable trading ideas that provide a wider context for their technical setups.
In many forms of technical analysis, traders struggle with “hope” when a trade goes against them. They move their stops or tell themselves the trend is still alive. In Elliott Wave, a broken rule is a gift. It tells you immediately and objectively that your count is wrong. If price enters the territory of Wave 1 during what you thought was a Wave 4 (violating Rule 3), the impulse is dead. You exit the trade, protect your capital, and wait for a new setup. By letting the rules dictate your exits, you remove the emotional stress that often leads to poor decision-making during market volatility.
Once you’ve mastered the 3 rules of Elliott Wave, you can begin to incorporate advanced guidelines like Fibonacci projections, channeling, and the principle of alternation. These tools don’t replace the rules, but they do add layers of probability to your analysis. We invite you to join the Wavetraders community to track these patterns together across various asset classes. If you’re ready for deeper mentorship and a structured path to expertise, the best way forward is to Apply for the Elliott Wave School today. With over two decades of experience, we can help you turn these foundational rules into a lifelong trading edge.
The 3 rules of Elliott Wave act as a definitive boundary between subjective guessing and professional analysis. By internalizing these laws, you’ve gained the ability to filter out low-probability setups and identify precisely where a market trend loses its integrity. These aren’t just academic concepts; they’re the foundation of a disciplined trading strategy that removes the emotional burden of decision-making. True mastery requires moving beyond theory and applying these principles to live price action every day.
Since 2003, we’ve provided over two decades of technical analysis expertise to help traders navigate FX, Crypto, and Commodities with composure. Whether you’re looking to pass a funded trader challenge or refine your personal strategy, expert guidance can significantly shorten your learning curve. Our community provides the daily real-time analysis and proprietary tools you need to stay ahead of the curve. We invite you to Master Wave Counting at the Wavetraders Elliott Wave School and take the next step in your trading journey with confidence. We look forward to tracking the markets together.
The three cardinal rules are specific boundaries that define a valid five-wave impulse. First, Wave 2 can never retrace more than 100% of Wave 1. Second, Wave 3 can never be the shortest of the three motive waves, which include waves 1, 3, and 5. Third, Wave 4 can never enter the price territory of Wave 1. If your chart violates any of these, the impulsive count is objectively incorrect.
No, the 3 rules of Elliott Wave apply to all liquid asset classes, including the crypto markets. While some traders believe high volatility allows for “sloppy” counts, a standard impulse in Bitcoin or Ethereum must still respect the no-overlap rule. If you see an overlap in a trending move, you are likely looking at a diagonal pattern or a corrective structure rather than a clean impulse.
If Wave 3 is the shortest of waves 1, 3, and 5, your impulsive count is immediately invalidated. You must re-examine the price action and look for an alternative interpretation. Often, a “short” Wave 3 suggests that the market is actually in a corrective ABC structure. Alternatively, you might be mislabeling a series of smaller sub-waves that are part of a larger, extended third wave.
Elliott Wave remains a primary tool for technical analysts in 2026 because it tracks the permanent patterns of human psychology. While standalone accuracy can vary, the theory is increasingly effective when combined with modern technical indicators and machine-learning algorithms. To see how these technologies can help you find new market leads, you can visit TickerAI and explore their AI-powered stock discovery tools. It continues to be applied across Forex, commodities, and digital assets to identify structural turns that purely quantitative methods might miss.
A correct count must first pass the 3 rules of Elliott Wave without exception. Once the rules are satisfied, you look for “guidelines” to increase your confidence, such as Fibonacci extensions and the principle of alternation. If the waves look proportional and the sub-waves follow the same internal logic, the count is likely valid. Many practitioners use real-time analysis services to verify their counts against experienced professionals.
Yes, a Wave 2 can legally retrace almost the entire length of Wave 1. As long as the price does not breach the exact starting point of Wave 1, the count remains valid. While deep retracements are common in volatile markets, they often test the patience of traders. If the price hits the 100% level, the trend reversal has failed, and the count must be abandoned.
No, these three specific rules only govern five-wave motive structures. Corrective waves, such as zigzags, flats, and triangles, follow a different set of guidelines and internal structures. While corrections are often complex, they don’t have the same “shortest wave” or “overlap” restrictions found in impulse waves. Understanding the difference between motive and corrective structures is essential for accurate labeling.
The primary difference is the overlap between Wave 4 and Wave 1. In a standard impulse, this overlap is strictly forbidden. In a diagonal, the overlap is a required structural feature that creates a wedge-like shape. Diagonals typically appear at the beginning or end of a larger trend, signaling that the momentum is either just starting to build or is reaching a climactic exhaustion point.
DISCLAIMER
Any reviews, news, analysis, prices or other information contained on our website is provided as general market commentary and delivered electronically through a distribution channel to larger number of clients, therefore does not constitute investment advice or investment research. We are not trading advisors. Most of our work is for educational purposes only, with information based on Elliott Wave theory in real time. Trading forex, futures, options, stocks, cryptocurrenices or any another trading market carries a high level of risk, and may not be suitable for all investors.
The possibility exists that you could lose some or all of your initial investment; therefore you should not invest money that you cannot afford to lose. Our website and the information that we provide should not be relied upon as a substitute for extensive independent research before making your investment decisions. In no event will we be liable for any loss or damage on your account in connection with, the use of our products. For any real cash investments you have to contact your financial advisor.
Any information or material contained on our website is owned by Val Global d.o.o.. Reproduction is prohibited without Val Global d.o.o. prior license in writing.
By continuing to use the site, you agree to the use of cookies. Learn more.
The cookie settings on this website are set to "allow cookies" to give you the best browsing experience possible. If you continue to use this website without changing your cookie settings or you click "Accept" below then you are consenting to this.