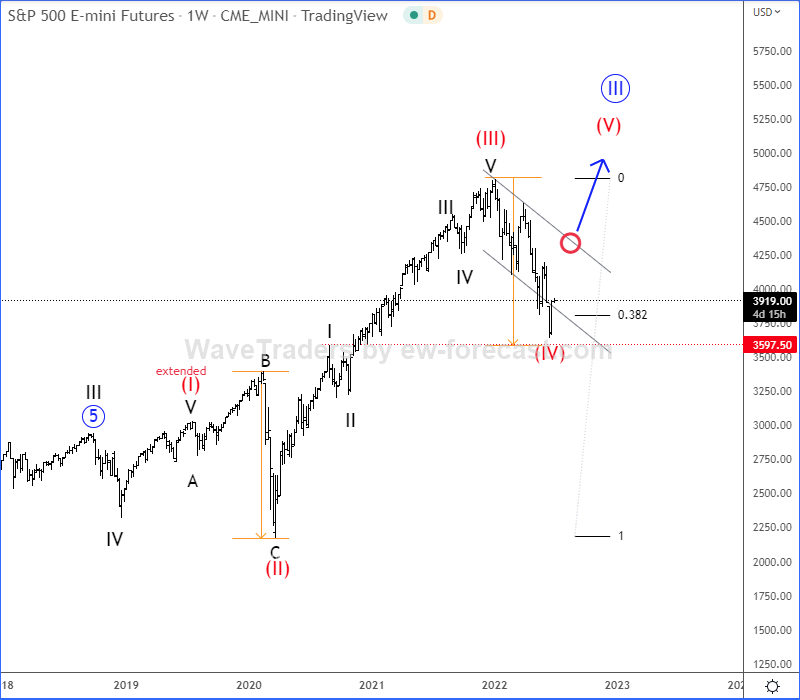
Hello traders, today we want to share SP500, as we see it trading at interesting and important weekly support area. We will talk about it from technical point of view and from Elliott wave perspective.
SP500 made a massive rally since March 2020 crash, in Elliott wave theory, clearly within a five-wave cycle which we see it as a higher degree wave (III). Recent decline from the highs looks slow, choppy and overlapped, so we believe it’s just a higher degree wave (IV) correction that can be now coming to an end.

From technical point of view we see now same wavelength wave (II) = wave (IV), right around 38,2% Fibonacci retracement, former subwave I swing high and 3600 area.
Well, if SP500 manages to recover back above resistance line of a corrective channel, then we can easily expect risk-on sentiment and bulls back in play within wave (V).
All the best!
Natural gas is slowing down within a higher degree correction. Check our chart HERE