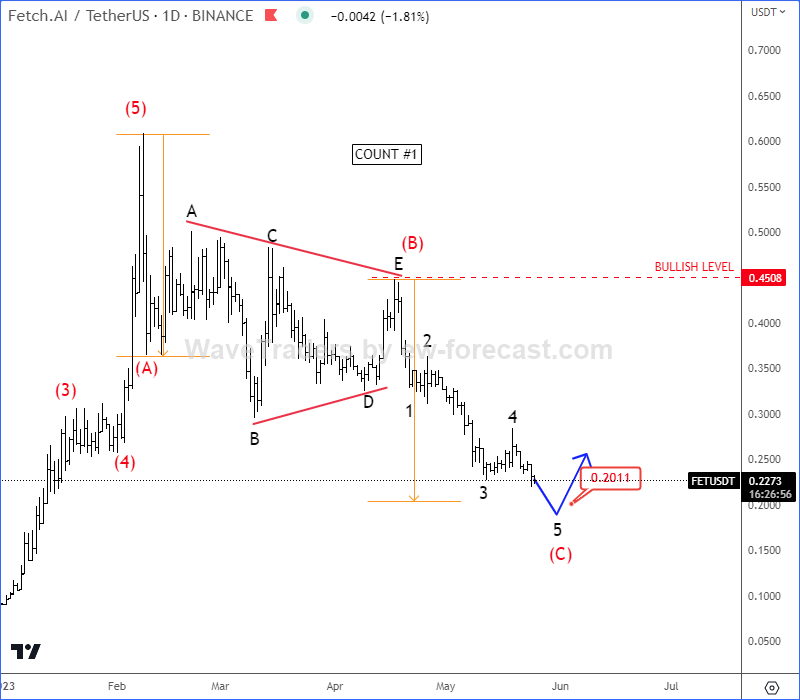
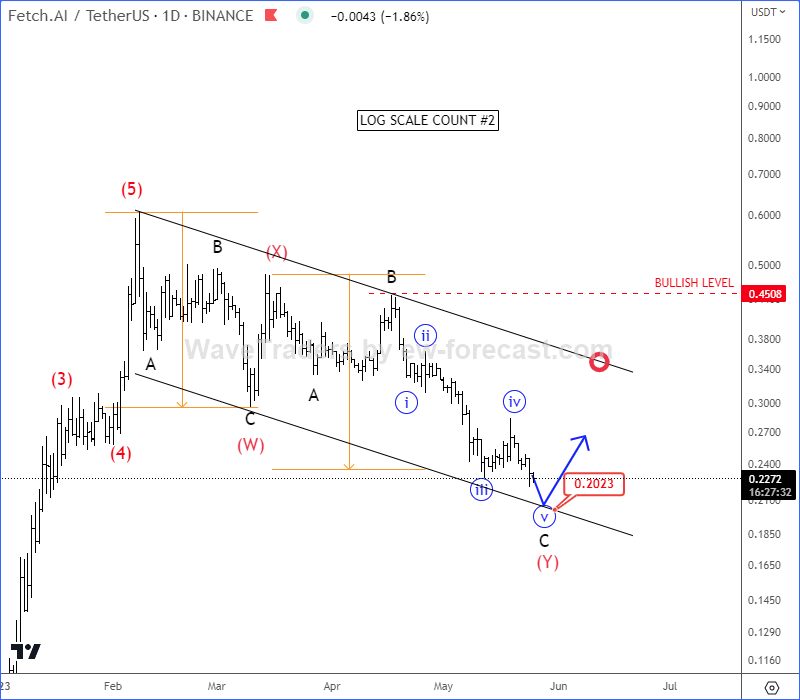
We can see Fetch.AI with ticker FETUSD approaching strong and important support area around 0.20 level based on two different daily counts. In the primary count, it can be coming down out of wave (B) triangle for wave (C), while in the secondary log scale count, we see it finishing a complex (W)-(X)-(Y) corrective decline with wave C of (Y) in final stages. Both counts can be now also finishing final subwave 5 wave of C, so be aware of a rebound soon, just keep in mind that bullish confirmation is only above 0.45 region.
Become a premium member
Get daily Elliott Wave updates for US Single Stocks, SP500,DAX, GOLD, SILVER, CRUDE, FX, CRYPTO, etc. or apply for unlimited access to the Elliot Wave educational videos.

The Kiwi Resumed Lower After A Corrective Rally. Check our blog HERE