Ethereum is outperforming stocks and commodities, as we see it forming bullish setups against NASDAQ and GOLD from Elliott wave perspective.
Hello traders, today we want to share some interesting Ethereum ratio charts against stocks, specifically NASDAQ and commodities, specifically GOLD.
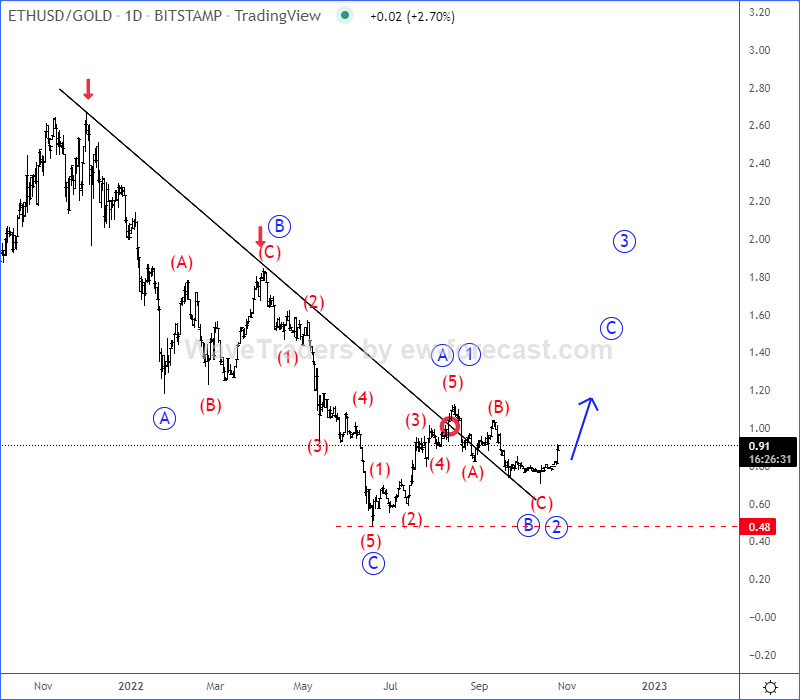
Looking at the daily Ethereum against GOLD (ETH/GOLD) ratio chart, we can already see broken trendline connected from the highs after a three-wave A-B-C correction. And, if we also consider a bullish setup formation with five waves up into wave A/1 and three-wave (A)-(B)-(C) correction in wave B/2, then higher degree C/3 can be already underway.

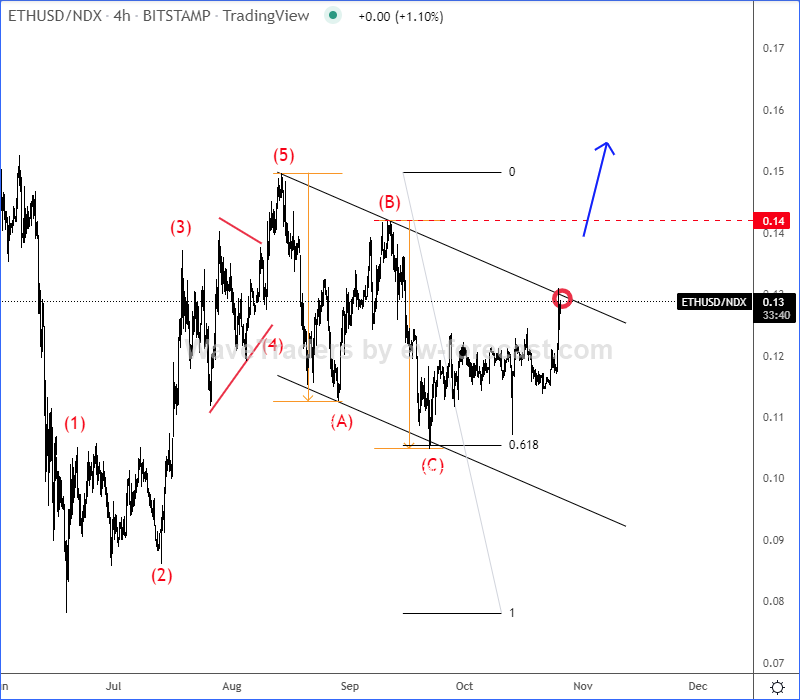
If we take a look at the 4-hour Ethereum against NASDAQ (ETH/NDX) ratio chart, we can also see a completed bullish setup formation with a perfect textbook pattern that can send the price higher, especially if we see broken resistance line of a corrective channel.

Well, if we are on the right path, then Ethereum could take-off soon, especially if stocks and commodities also find the strong support and start recovering.
All the best!
For more analysis, check our latest video analysis sponsored by Orbex. CLICK HERE