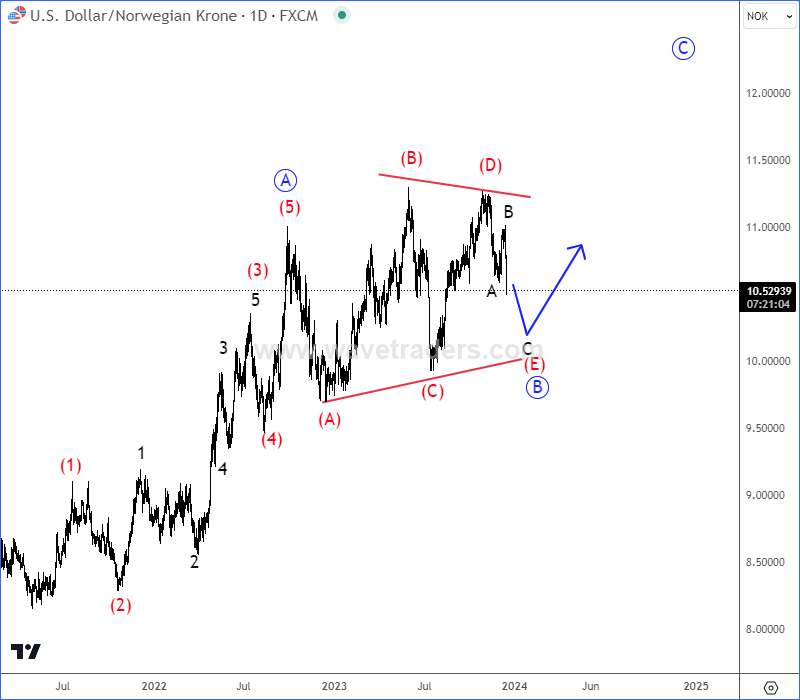
USDNOK Can Be Trapped In A Triangle due to a weak Norwegian krone (NOK) in the last year.
Since the beginning of 2023, USDNOK is trading in sideways consolidation that can be a corrective (A)-(B)-(C)-(D)-(E) running triangle pattern within wave B before we will see a bigger recovery for wave C of B. On a daily chart it can be now slowing down within final subwave (E) that can retest lower triangle line near 10.0 support level.

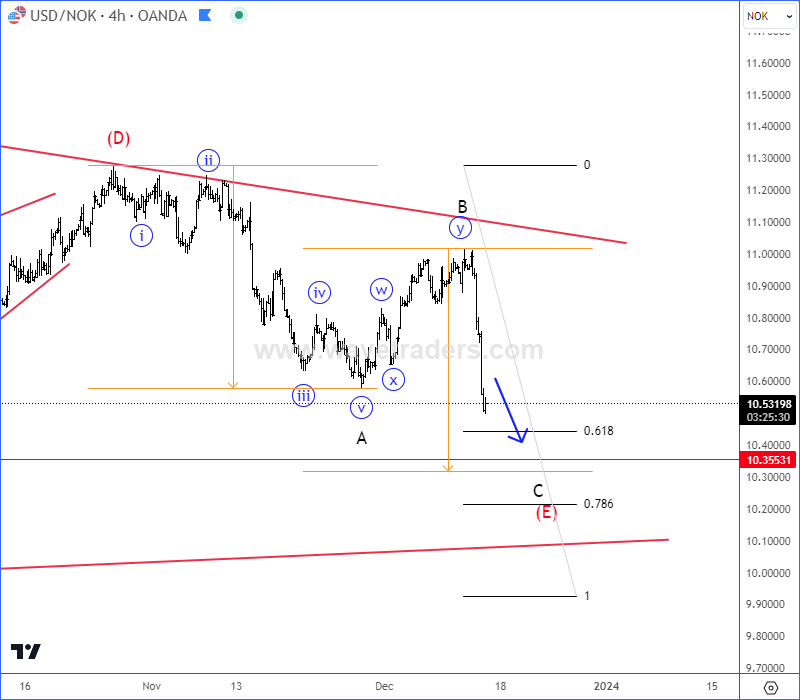
Looking at the 4-hour chart, USDNOK is coming down within a three-wave A-B-C decline for a higher degree wave (E) as expected. Currently we are already tracking wave C of (E), but there can be room down to 10.30 – 10.20 area before it finds the support.

Become a premium member
Get daily Elliott Wave updates for SP500,DAX, GOLD, SILVER, CRUDE, FX, CRYPTO, etc. or apply for unlimited access to the Elliot Wave educational videos.
ETHBTC Pair Is Nearing 2022 Lows Support. Check our free chart HERE.