A step-by-step look at how USDMXN completed an ABC corrective recovery, reacted at projected resistance, broke below confirmation support, and transitioned into a new bearish impulsive decline.
1. ABC Corrective Recovery
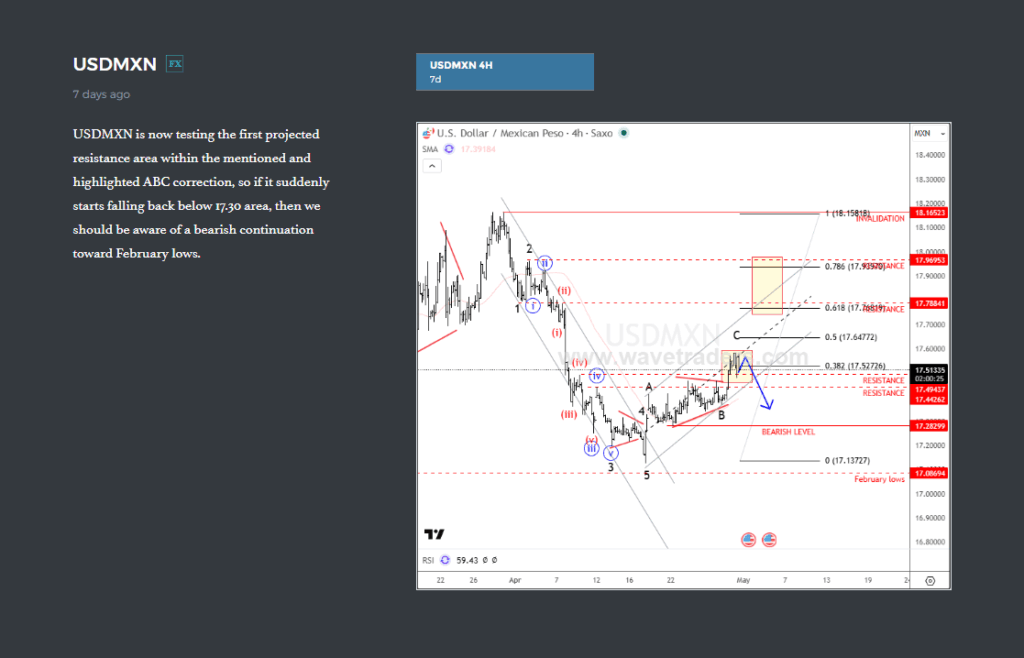
USDMXN started forming a projected ABC correction after a strong bearish five-wave impulsive decline. The first resistance zone around 17.40 was identified as a possible completion area for wave C, while the 17.70–17.90 region remained the next higher resistance target in case of a deeper recovery.

2. Resistance Test
Price pushed into the projected resistance area almost exactly as anticipated. Momentum started slowing down, warning that the corrective structure may be close to completion. At this stage, a drop back below the 17.30 support region would increase the probability of bearish continuation.
3. Bearish Confirmation
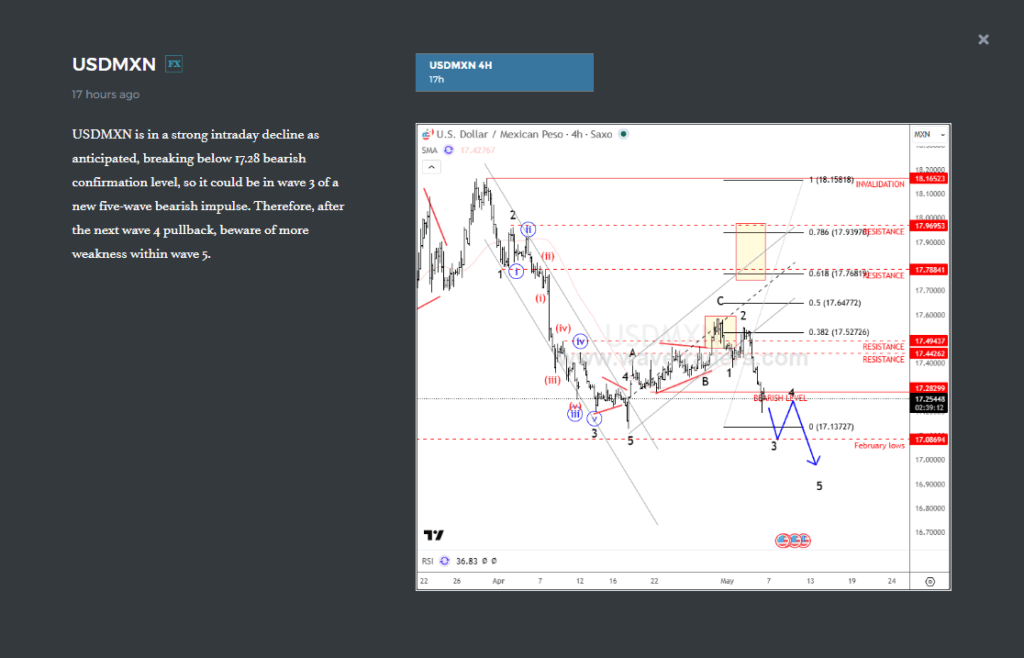
USDMXN then broke back below intraday channel support and slipped under the 17.28 bearish confirmation level, confirming weakness after the completed ABC correction and activating the bearish continuation scenario toward lower levels.

4. New Bearish Impulse
The decline accelerated as anticipated, suggesting the market may already be developing wave 3 of a new five-wave bearish impulse. With downside momentum strengthening, any upcoming wave 4 corrective rebound could offer another opportunity before potential continuation lower within wave 5.
Key Educational Takeaway
This sequence highlighted how combining Elliott Wave structure, Fibonacci resistance zones, and confirmation-based execution can help traders follow market development step by step instead of trying to predict reversals too early.
Become a premium member
Get daily Elliott Wave updates for US Single Stocks, SP500,DAX, GOLD, SILVER, CRUDE, FX, CRYPTO, etc. or apply for unlimited access to the Elliot Wave educational videos.