When markets trade sideways, there are still opportunities — if you know where to look.
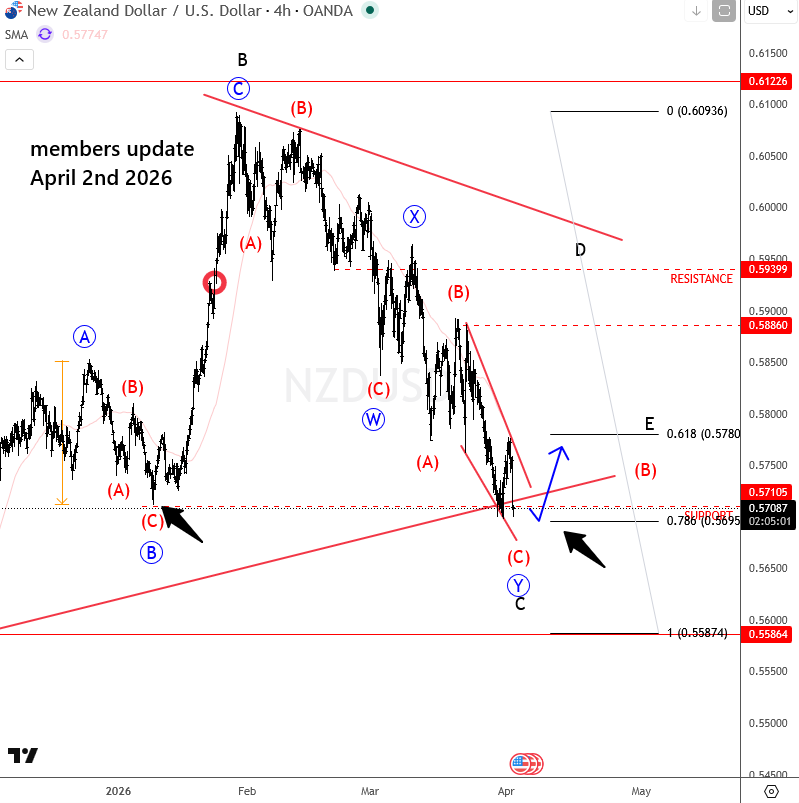
Back in early April, while NZDUSD was stuck in a choppy and overlapping range, we identified a completed ending diagonal near the 0.5680 area. That setup pointed to a potential reversal, even though broader price action remained corrective and uncertain.
Educational post at the end
As shown in the charts, price respected that zone perfectly and delivered a strong impulsive move higher. This is a good example of how even within complex, sideways structures, key technical patterns can provide high-probability setups, highlighted with our yellow boxes.
While the bigger picture still suggests a broader triangle and limited upside, the reaction from the lows confirms that the market respected our outlined scenario. It also highlights the importance of patience and precision when trading in non-trending conditions.
Opportunities are always there — the key is recognizing them before the move unfolds.
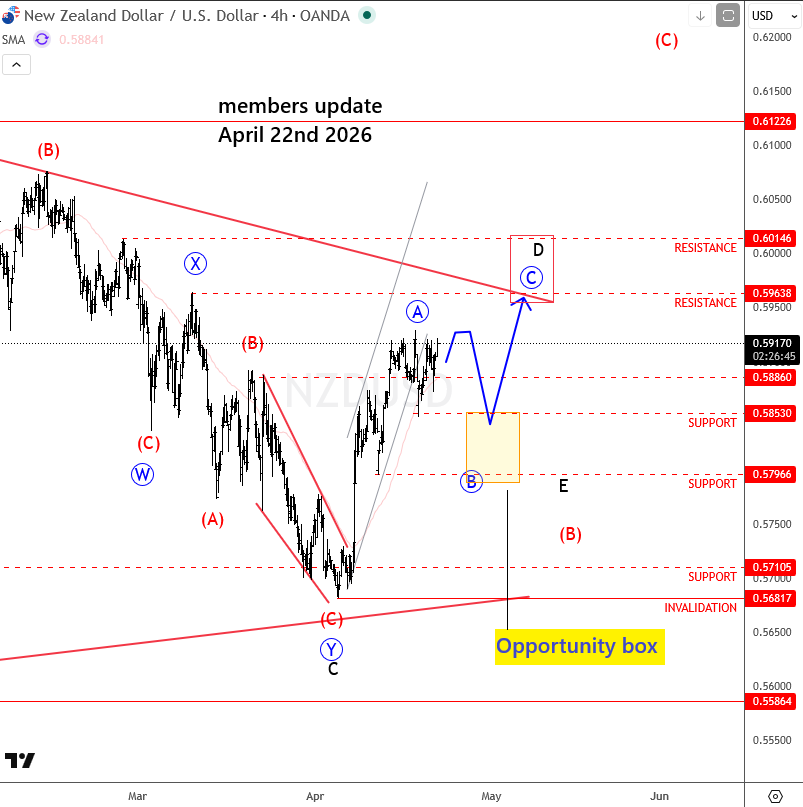
Currently, NZDUSD is pushing nicely to the upside since April, after we identified a completed ending diagonal around 0.5681. From there, we’ve seen a strong and impulsive reversal, which suggests the market has turned bullish, at least temporarily.
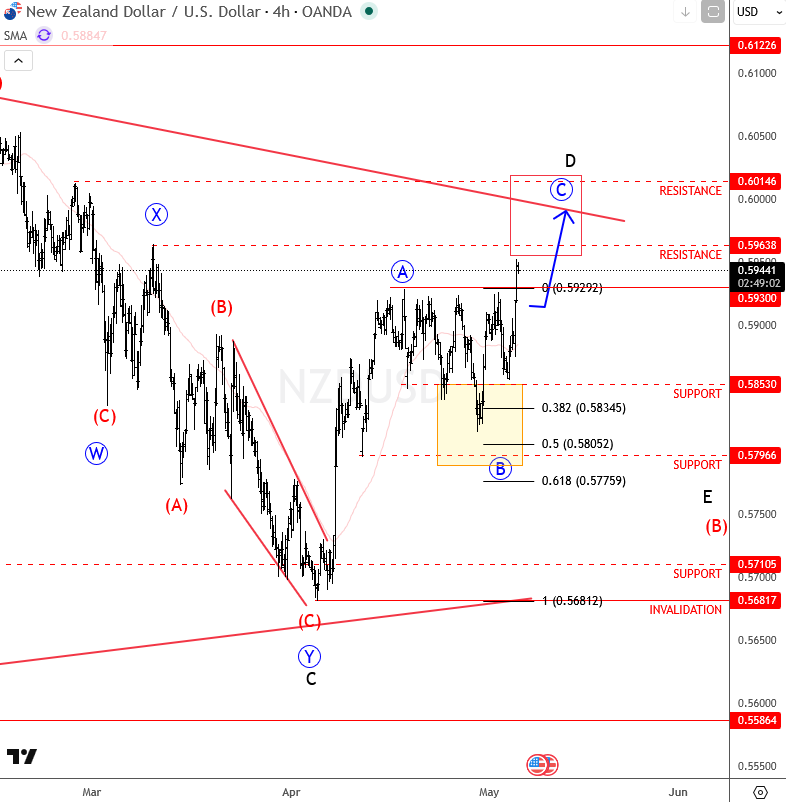
This type of structure usually points to more upside within a higher degree A-B-C recovery, ideally in wave D, which could target the upper side of the broader triangle around 0.5960 to 0.6010. That zone may act as resistance where the upside could be limited within the ongoing triangle as shown on a daily chart.
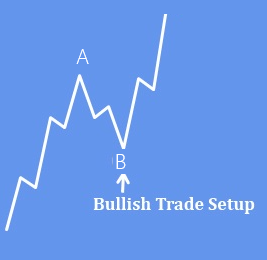
Corrective Zigzag Move – ABC
In a classic zigzag (A–B–C), those Fibonacci levels matter because they help define how corrective vs. impulsive the structure is — especially wave B which can offer an opportunity on pullback, when wave A is impulsive like in our case on kiwi.
0.382 Fibonacci Level
- A shallow retracement (~38.2%) tells you the market is strongly trending.
- In a zigzag, this usually means:
- Wave B is weak
- Momentum is still in the direction of wave A
- That’s why shallow B waves often lead to strong wave C extensions — the trend resumes aggressively.
0.500 Fibonacci Level
- The 50% retracement is more of a balance zone — not as shallow, not too deep.
- It suggests:
- The market is correcting properly, but not reversing
- Structure is still clean and typical for a zigzag
- This is very common for wave B in a textbook zigzag, and offers opportunity to catch wave C move while wave B trades above starting point of wave A.
Become a premium member
Get daily Elliott Wave updates for US Single Stocks, SP500,DAX, GOLD, SILVER, CRUDE, FX, CRYPTO, etc. or apply for unlimited access to the Elliot Wave educational videos.