We have been talking a lot about bullish setup formation on Treasury bond TLT in the last couple of months. We also shared a free chart on April 26, where we mentioned and highlighted key support within an A-B-C corrective decline. CLICK HERE

Later on May 16, TLT nicely bounced after we spotted a completed A-B-C corrective decline. With a break above channel resistance line, we were pointing for a new impulsive rally that can send the price back to yearly highs and 100 area. CLICK HERE for an article from May 16th.

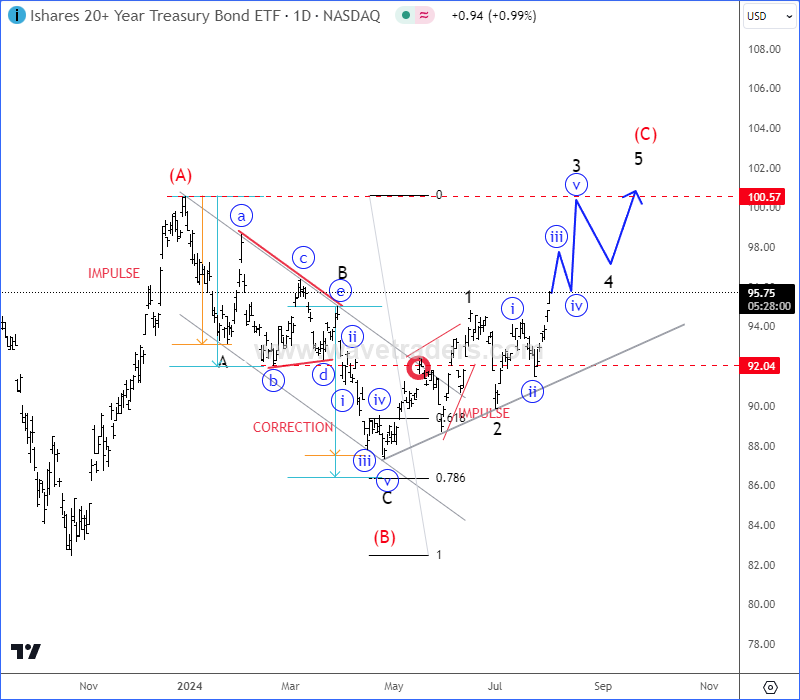
As you can see today on August 1st, TLT is grinding impulsively higher and there is plenty of space to complete a lower degree five-wave bullish cycle towards yearly highs and 100 area, just be aware of short-term pullbacks.
Become a premium member
Get daily Elliott Wave updates for US Single Stocks, SP500,DAX, GOLD, SILVER, CRUDE, FX, CRYPTO, etc. or apply for unlimited access to the Elliot Wave educational videos.