Stocks

SP500: Textbook Break out of a Triangle and ReversalApr 3, 2024

SP500 made a textbook breakout from an Elliott Wave triangle pattern, after we saw it consolidating within a strong bullish trend

SP500 is in strong higher degree bullish trend which may not be over just yet on the big picture, but sometimes it’s good to scale down to smaller time frames, and recognize the wave pattern that can give you an interesting opportunity in the direction of a main trend. Well, we been tracking these intraday developments quite closely on the SP500, thus we want to highlight how we done it.

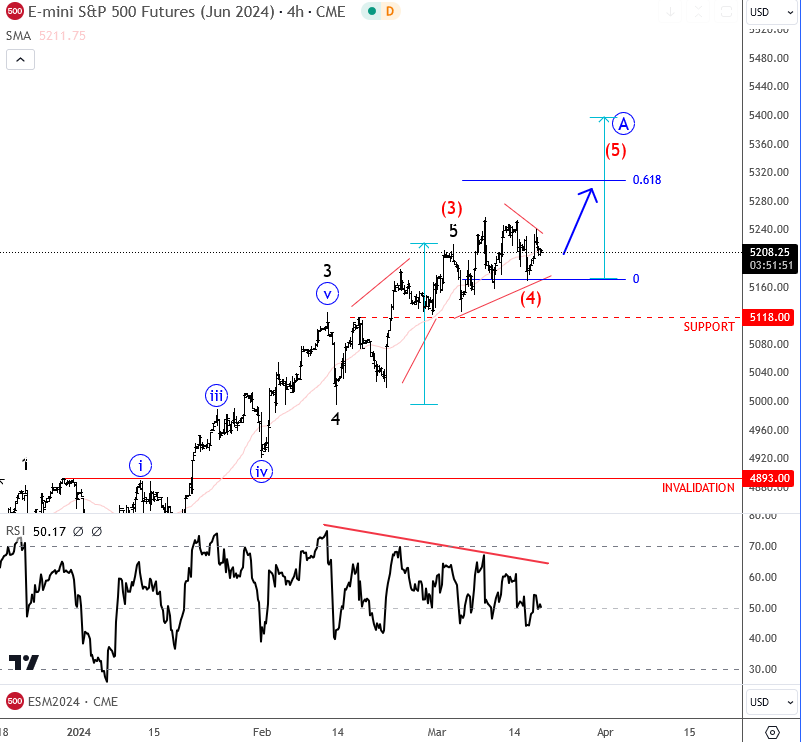
On March 19 we have noticed a sideways consolidation, which usually represents a wave (4) pause, in our case that was an Elliott wave triangle corrective pattern which was important one for a new break higher into a wave (5). We specifically highlighted important Fib projection levels near 5320-5400.

SP500: Textbook Breakout From A Triangle SP500 4H Chart From March 19
SP500 4H Chart From March 19

Later, on March 28th, we have seen a nice bullish breakout from a projected wave (4) triangle pattern as expected. So, we were tracking wave (5), but a lower degree five-wave cycle was unfinished and that’s why we expected another and final push to the upside for the final five of five.

SP500: Textbook Breakout From A Triangle SP500 4H Chart From March 28
SP500 4H Chart From March 28

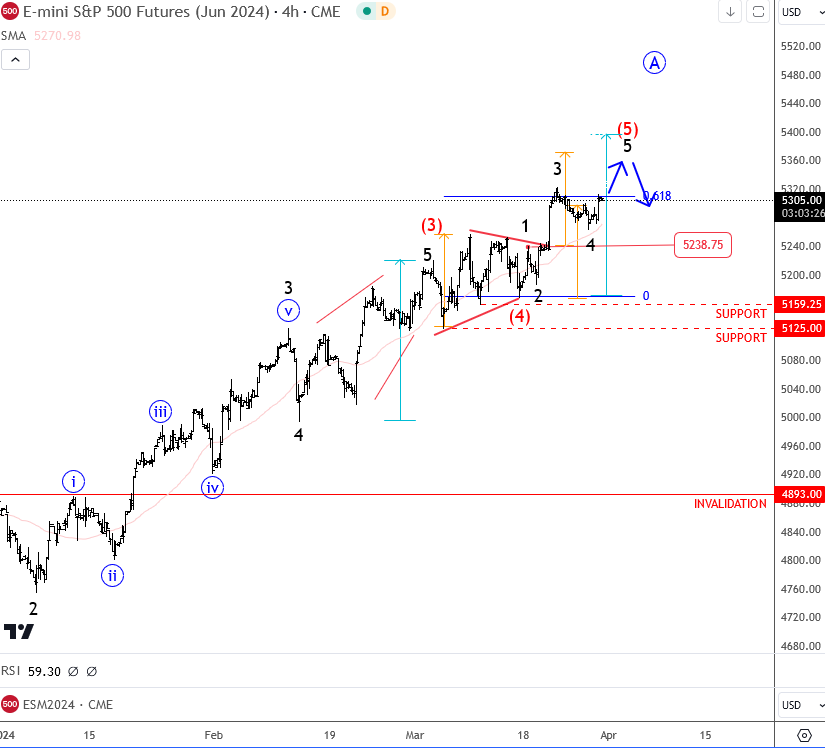
Whats even more important is that whenever you have a move out of a triangle, this can then be a final one sequence. So we warned about limited gains and a reversal

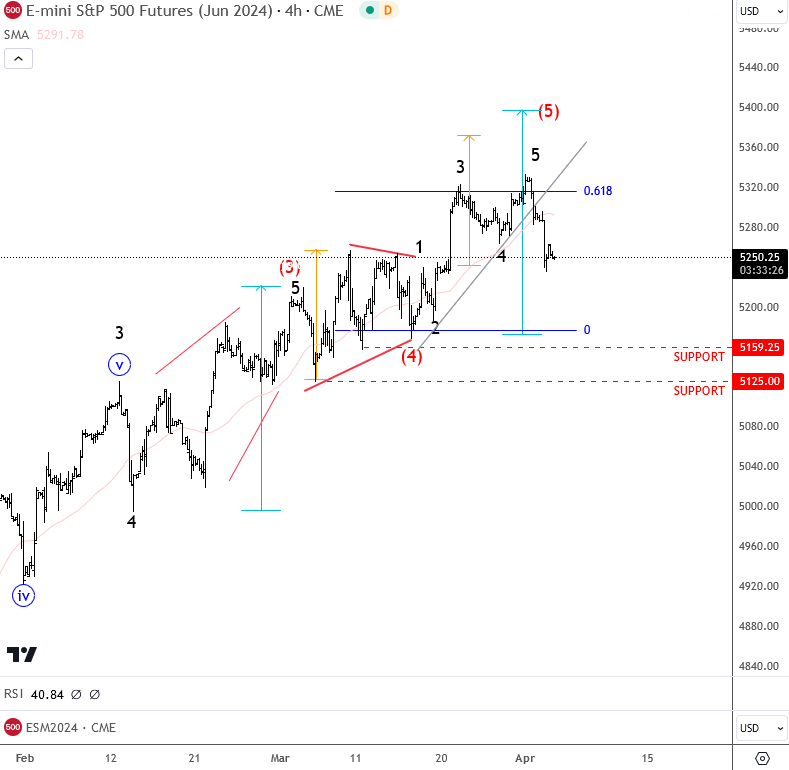
As you can see as today, April 3rd, SP500 is turning sharply down after a completed five wave sequnce. It looks like bulls are on the pause, but what’s next? Correction, or a top?

Join us in our premium services and track SP500 daily.

SP500: Textbook Breakout From A Triangle SP500 4H Chart From April 03
SP500 4H Chart From April 03

Become a premium member

Get daily Elliott Wave updates for some major Digital currencies, FIAT currency markets, major stock indexes, gold, silver, crude etc. or apply for unlimited access to the Elliot Wave educational videos.

Crypto Market Is Still In A Higher Degree Correction. Check our free chart HERE.

DISCLAIMER

Any reviews, news, analysis, prices or other information contained on our website is provided as general market commentary and delivered electronically through a distribution channel to larger number of clients, therefore does not constitute investment advice or investment research. We are not trading advisors. Most of our work is for educational purposes only, with information based on Elliott Wave theory in real time. Trading forex, futures, options, stocks, cryptocurrenices or any another trading market carries a high level of risk, and may not be suitable for all investors.

The possibility exists that you could lose some or all of your initial investment; therefore you should not invest money that you cannot afford to lose. Our website and the information that we provide should not be relied upon as a substitute for extensive independent research before making your investment decisions. In no event will we be liable for any loss or damage on your account in connection with, the use of our products. For any real cash investments you have to contact your financial advisor.

Any information or material contained on our website is owned by Val Global d.o.o.. Reproduction is prohibited without Val Global d.o.o. prior license in writing.

By continuing to use the site, you agree to the use of cookies. Learn more.

The cookie settings on this website are set to "allow cookies" to give you the best browsing experience possible. If you continue to use this website without changing your cookie settings or you click "Accept" below then you are consenting to this.

Close