Stocks

SP500: Applying Elliott Wave Theory to Navigate The Short-term Structure In Sideways MarketsApr 7, 2023

When markets are trapped in a big range and traders are undecided about future moves, it can be challenging to determine the next potential direction. However, Elliott Wave Theory provides a framework for identifying patterns in market behavior, even in uncertain times.

According to Elliott Wave Theory, market trends move in a series of waves that are driven by the psychology of market participants. By identifying these waves and their patterns, traders can gain valuable insights into market trends and make more informed trading decisions.

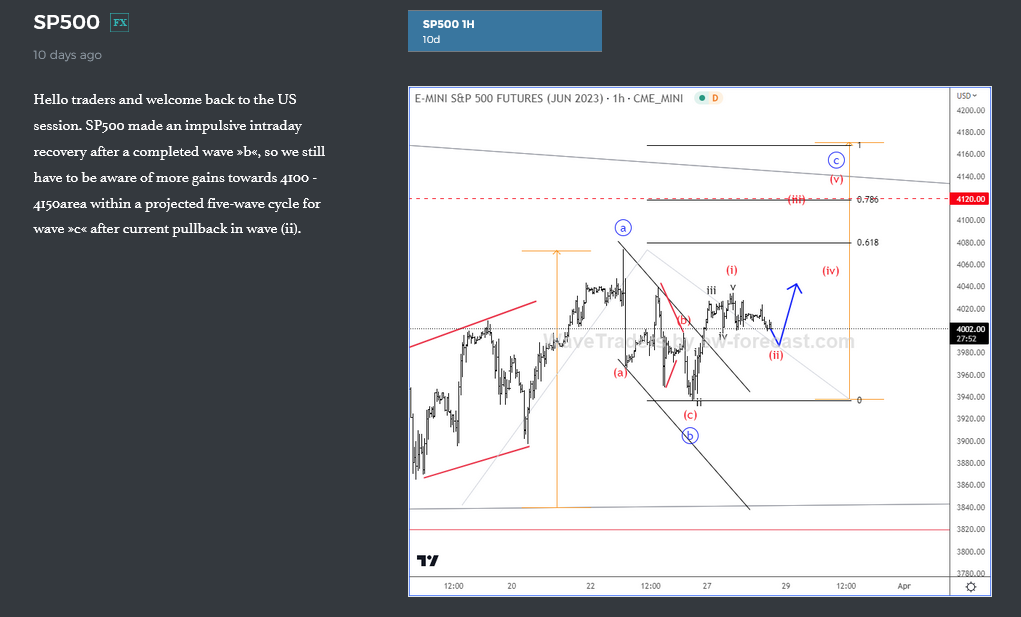
In the case of the SP500, on March 30th, a bullish reversal mode was identified on the hourly chart. Despite a three-wave drop from 4075, the corrective price action suggested a continuation higher, even if just temporarily for wave c. By tracking subwave (ii) of c and its bullish formation, the expectation was for a higher wave three.

SP500: Applying Elliott Wave Theory to Navigate The Short-term Structure In Sideways Markets sp500 futures
Mar 30 2023; SP500 Futures-members update“Bullish for wave three”

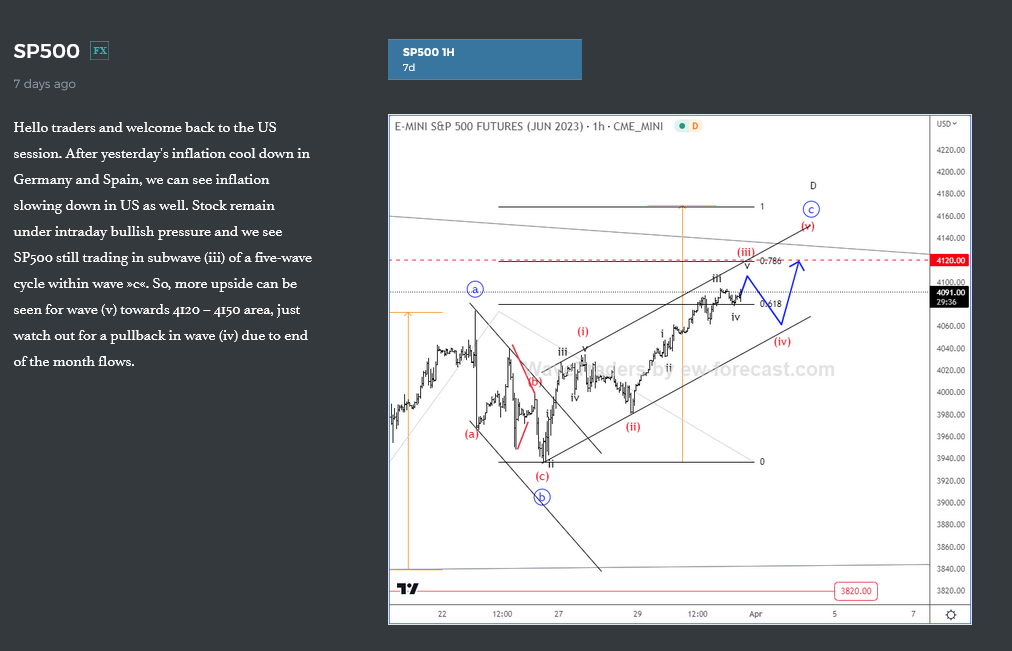
As shown on the chart, the market subsequently resumed higher, confirming the anticipated bullish move. However, as the author notes, not all waves are as easy to predict as others, and it’s important to track markets that have clear structure and simple patterns.

SP500: Applying Elliott Wave Theory to Navigate The Short-term Structure In Sideways Markets sp500 4h chart
Apr 03 2023 2023: SP500 Update

The question is now, where we go from here? Well, sometimes some waves are much easier to predict than others. So as traders or investors is important to track and keep an eye on the markets that have very clear structure and simple pattern. Normally, when you can recognize the pattern and Elliott wave structure in just a few seconds after opening the chart, then surely, this market can be interesting to identify the next potential direction. By recognizing the patterns, traders can gain insights into potential market trends and make more informed trading decisions.

If you want to learn more about my perspective on the SP500 on a higher degree scale, check out the video. CLICK HERE

Trade well,

Grega

Aussie Is Looking For Lower Support. Check our free chart HERE

DISCLAIMER

Any reviews, news, analysis, prices or other information contained on our website is provided as general market commentary and delivered electronically through a distribution channel to larger number of clients, therefore does not constitute investment advice or investment research. We are not trading advisors. Most of our work is for educational purposes only, with information based on Elliott Wave theory in real time. Trading forex, futures, options, stocks, cryptocurrenices or any another trading market carries a high level of risk, and may not be suitable for all investors.

The possibility exists that you could lose some or all of your initial investment; therefore you should not invest money that you cannot afford to lose. Our website and the information that we provide should not be relied upon as a substitute for extensive independent research before making your investment decisions. In no event will we be liable for any loss or damage on your account in connection with, the use of our products. For any real cash investments you have to contact your financial advisor.

Any information or material contained on our website is owned by Val Global d.o.o.. Reproduction is prohibited without Val Global d.o.o. prior license in writing.

By continuing to use the site, you agree to the use of cookies. Learn more.

The cookie settings on this website are set to "allow cookies" to give you the best browsing experience possible. If you continue to use this website without changing your cookie settings or you click "Accept" below then you are consenting to this.

Close