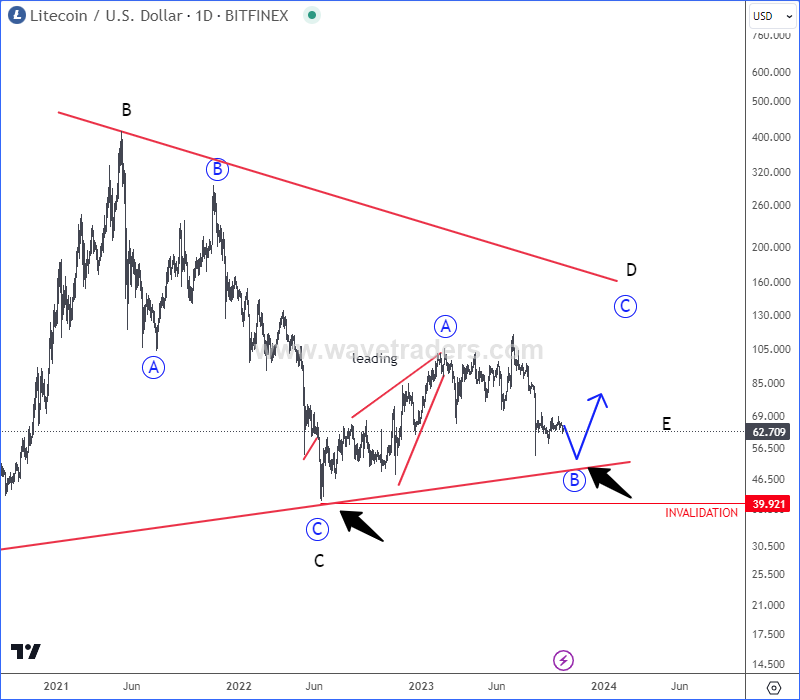
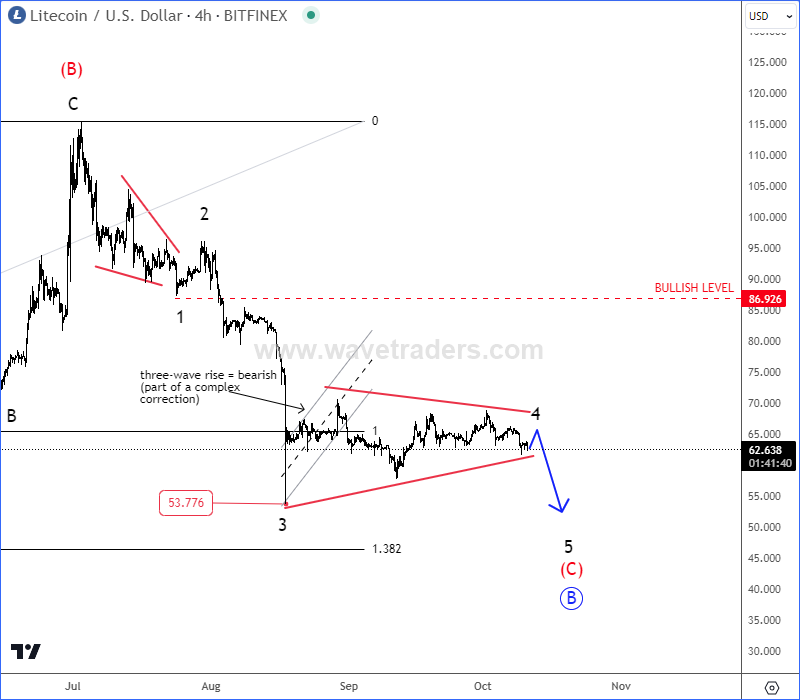
Litecoin Is Eyeing 50-40 Support Zone from technical point of view and from Elliott wave perspective.
Litecoin with ticker LTCUSD is still in a sideways consolidation within uptrend on a daily and weekly chart after recent decline, with current price testing the major trendline support connected from 2020 lows. As long this one holds, there is a chance for recovery still, ideally up into higher degree wave D once current wave B of D is finished.

For now this wave B is still underway with subwave (C) that has to be made by five waves down from 115. So if we are correct then the market is now in corrective subwave 4 bearish triangle pattern, from where final leg down can show up, and then we can ideally expect a bottom near $45-50 area, at 138.2% Fib extension. Bulls can be considered only if suddenly jumps back above 87 level.

We talked about cryptocurrencies and other markets in our live webinar from October 09. You can watch a recording below:
Become a premium member
Get daily Elliott Wave updates for US Single Stocks, SP500,DAX, GOLD, SILVER, CRUDE, FX, CRYPTO, etc. or apply for unlimited access to the Elliot Wave educational videos.
Higher Degree Correction Drops Oil To 80-75. Check our latest video analysis by Orbex HERE.