Elliot Wave Analysis for INVESCO COMMODITY TRACKING INDEX FUND
Invesco is an investment management company that acquired the Power Shares Capital Management firm in 2004 so that to get access to the exchange-traded fund business (ETFs). It manages over 120 ETFs, and one of them is the PowerShare Commodity Index Tracking Fund or DBC. Just to say that ETFs are products referring to stocks, bonds, futures, commodities, or indices that replicate a specific market. One example is the S&P 500 ETF which consists of all its companies with the same weight as the real index.
The DBC is traded at $24.97, having its high value at $46,63 in July 2008, as well as its all-time low at $10,41 in March 2020 during the Pandemic.
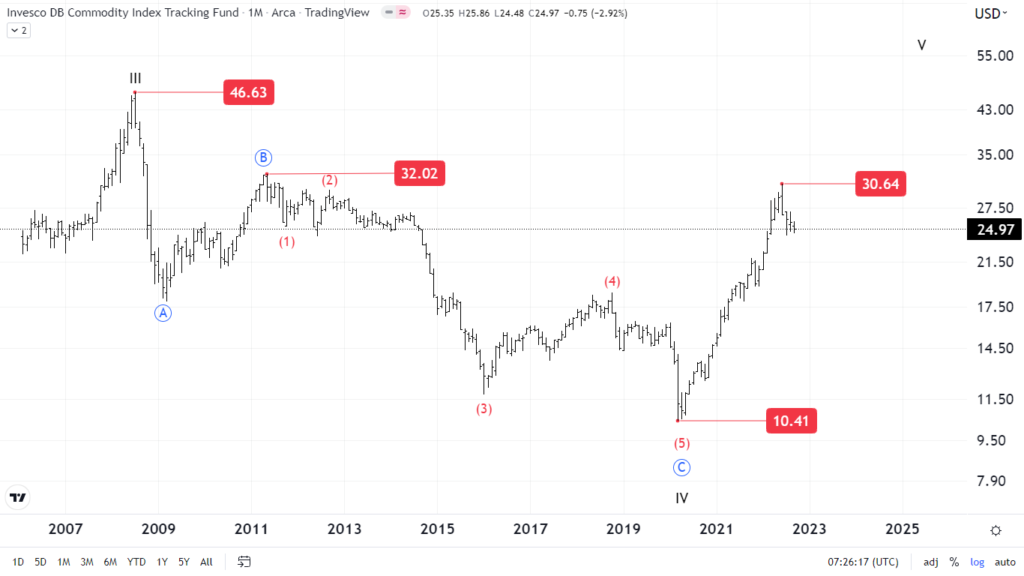
On the monthly trading chart (log scale) against $10,41 in March 2020, Invesco Commodity Index Fund started a sharp rally reaching the levels of the previous ((B)) Primary of the IV Cycle wave where the peak, as a decline of an ((A)) – ((B)) – ((C)) Primary waves that constructed a zig-zag, was at $32,02. The end of the III Cycle wave was at the all-time high that previously was said.
The current upward movement seems like a 5-wave sequence, but we are not sure. Only one thing is for sure. That rising, ruined the downtrend since it broke the last (4) Intermediate wave of the ((C)) Primary. Hence, we expect to see a corrective mood with a 3-wave count mode, in some support levels, and after that is all right to take the trade with almost a risk/reward ratio of 1:2.
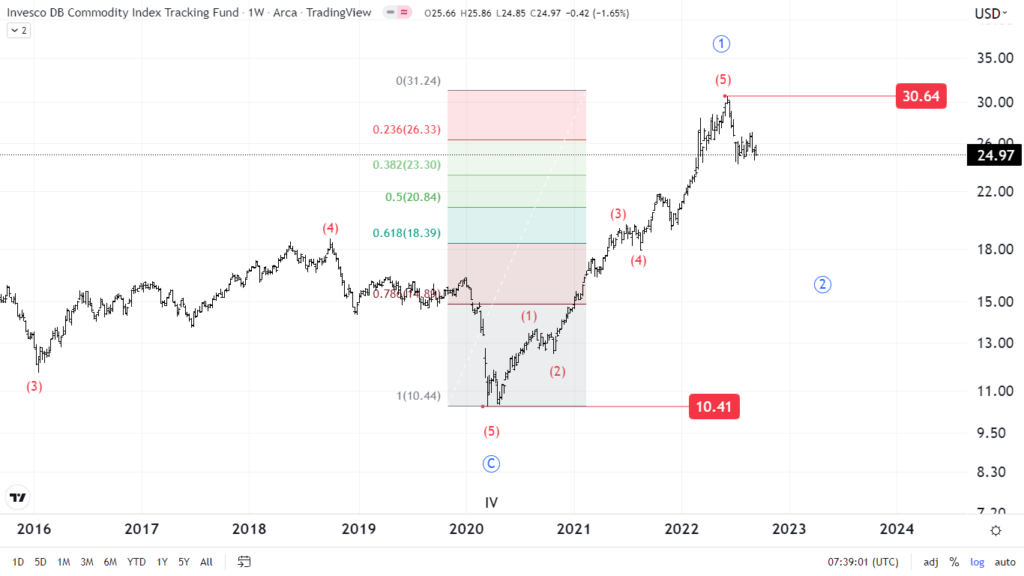
Going down respecting the weekly trading timeframe (log scale), at the end of the IV Cycle wave, an impulse has unfolded as of a (1) – (5) Intermediate waves subdivision. Getting closer to the peak of ((B)) Primary of IV Cycle wave at $32.02, the ETF reached the $30,64 price, but it couldn’t exceed it.
Our market forecast says that we are in the middle of a corrective mood, since the stock has already reached the 23,6% Fibonacci retracement level and still looking lower to complete the ((2)) Primary of the V Cycle wave. Hence, we suggest staying out of the market for a while until we see a 3-wave sequence corrective pattern for this unfinished ((2)) Primary of the V Cycle wave. Besides, it’s preferable to see the first two legs of an unfinished impulse rather than to trade against the main trend.
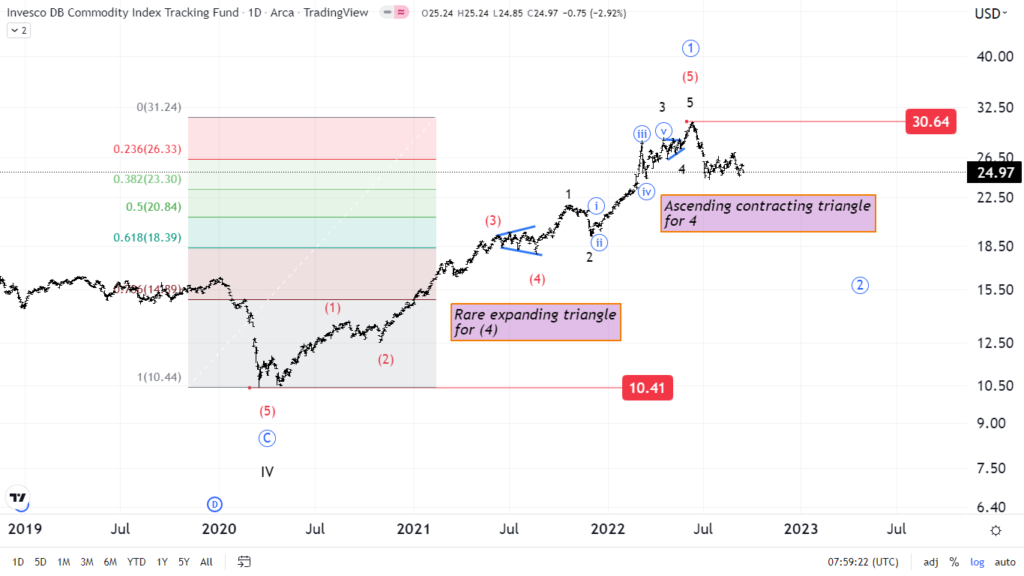
Zoomed in the current upward impulse as shown at the daily trading chart (log scale), this impulse as of the ((1)) Primary of the V Cycle is over in our point of view, and the correction which started to go toward the first support of the 4 Minor of ((5)) Primary of the V Cycle wave at $27,36 proved inefficient.
According to the Elliot Wave Principle’s guidelines, after an extended fifth wave, the market retraced to its second lesser degree wave, which here is the respective 2 Minor of the (5) Intermediate of the ((1)) Primary of the V Cycle wave, as well as simultaneously the (4) Intermediate of the ((1)) Primary of the V Cycle wave, which was an expanding triangle.
So, the unfinished ((2)) Primary of the V Cycle wave should fall further at $23.30, or at $20.84, or even at the $18.39, which are the 38,2%, 50%, and 61,8% multiples of the ((1)) Primary Fibonacci retracement levels respectively. The only ‘’must’’ is to form a 3-wave sequence only.
By Stavros Chanidis
If you like what we do, then you can also check our latest video analysis. CLICK HERE