Hello Crypto traders and investors. Today we will talk about Crypto market in general, as we see it nearing strong and important support zone.
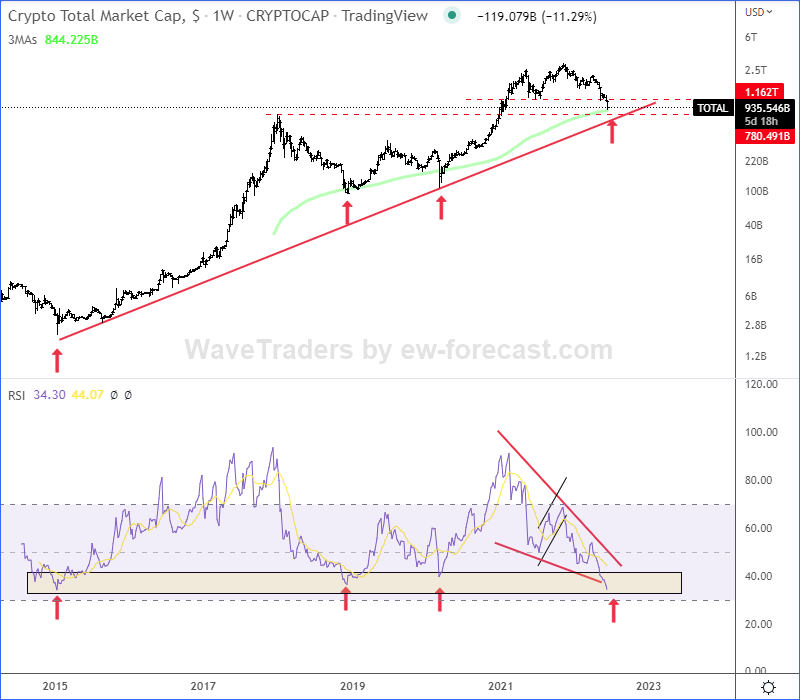
Well, if we look first at the big weekly Crypto total market cap chart, we can see it finally approaching projected and very important strong weekly trendline and 200-week Moving Average. It comes exactly around previous 2017 all-time highs resistance that can act as a reversal point. If we also consider extreme RSI oversold levels, which is telling us there’s a huge pessimism, then bullish reversal may not be far away.

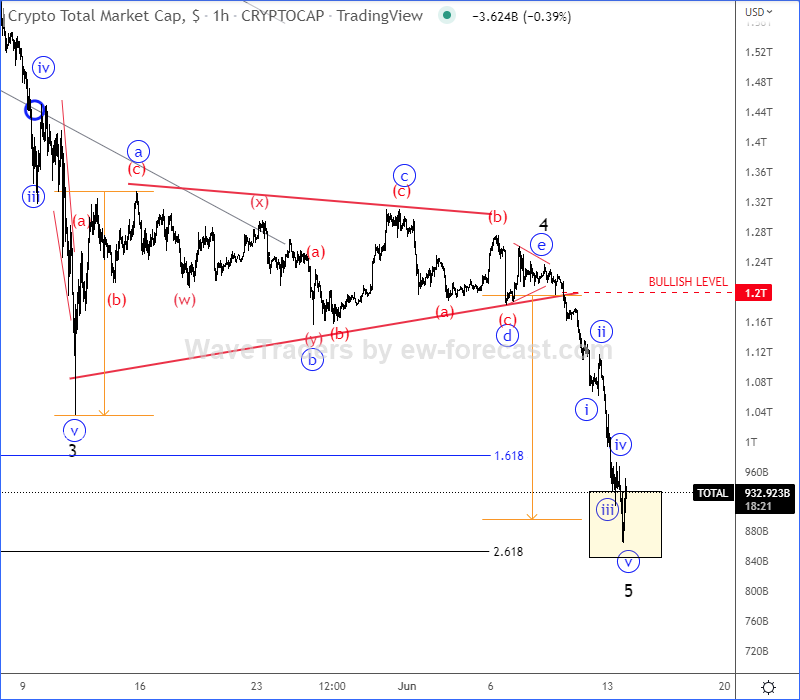
The main reason why we think and believe that support and bullish reversal is close is due to Elliott wave perspective. Looking at the intraday Crypto Total Market Cap chart, we can see it trading in final stages of 5th wave of a higher degree wave (C). It actually suggests limited downside, especially when we see it down out of wave 4 triangle pattern.

However, we still need to see an intraday five-wave recovery to confirm low in place, so caution and patience. All eyes are on tomorrow’s important FED meeting. It might be catalyst and trigger for a rebound, recovery and potentially bullish turn.
All the best!
If you are interested in cryptocurrencies, then you may want to check our latest count for Solana. CLICK HERE