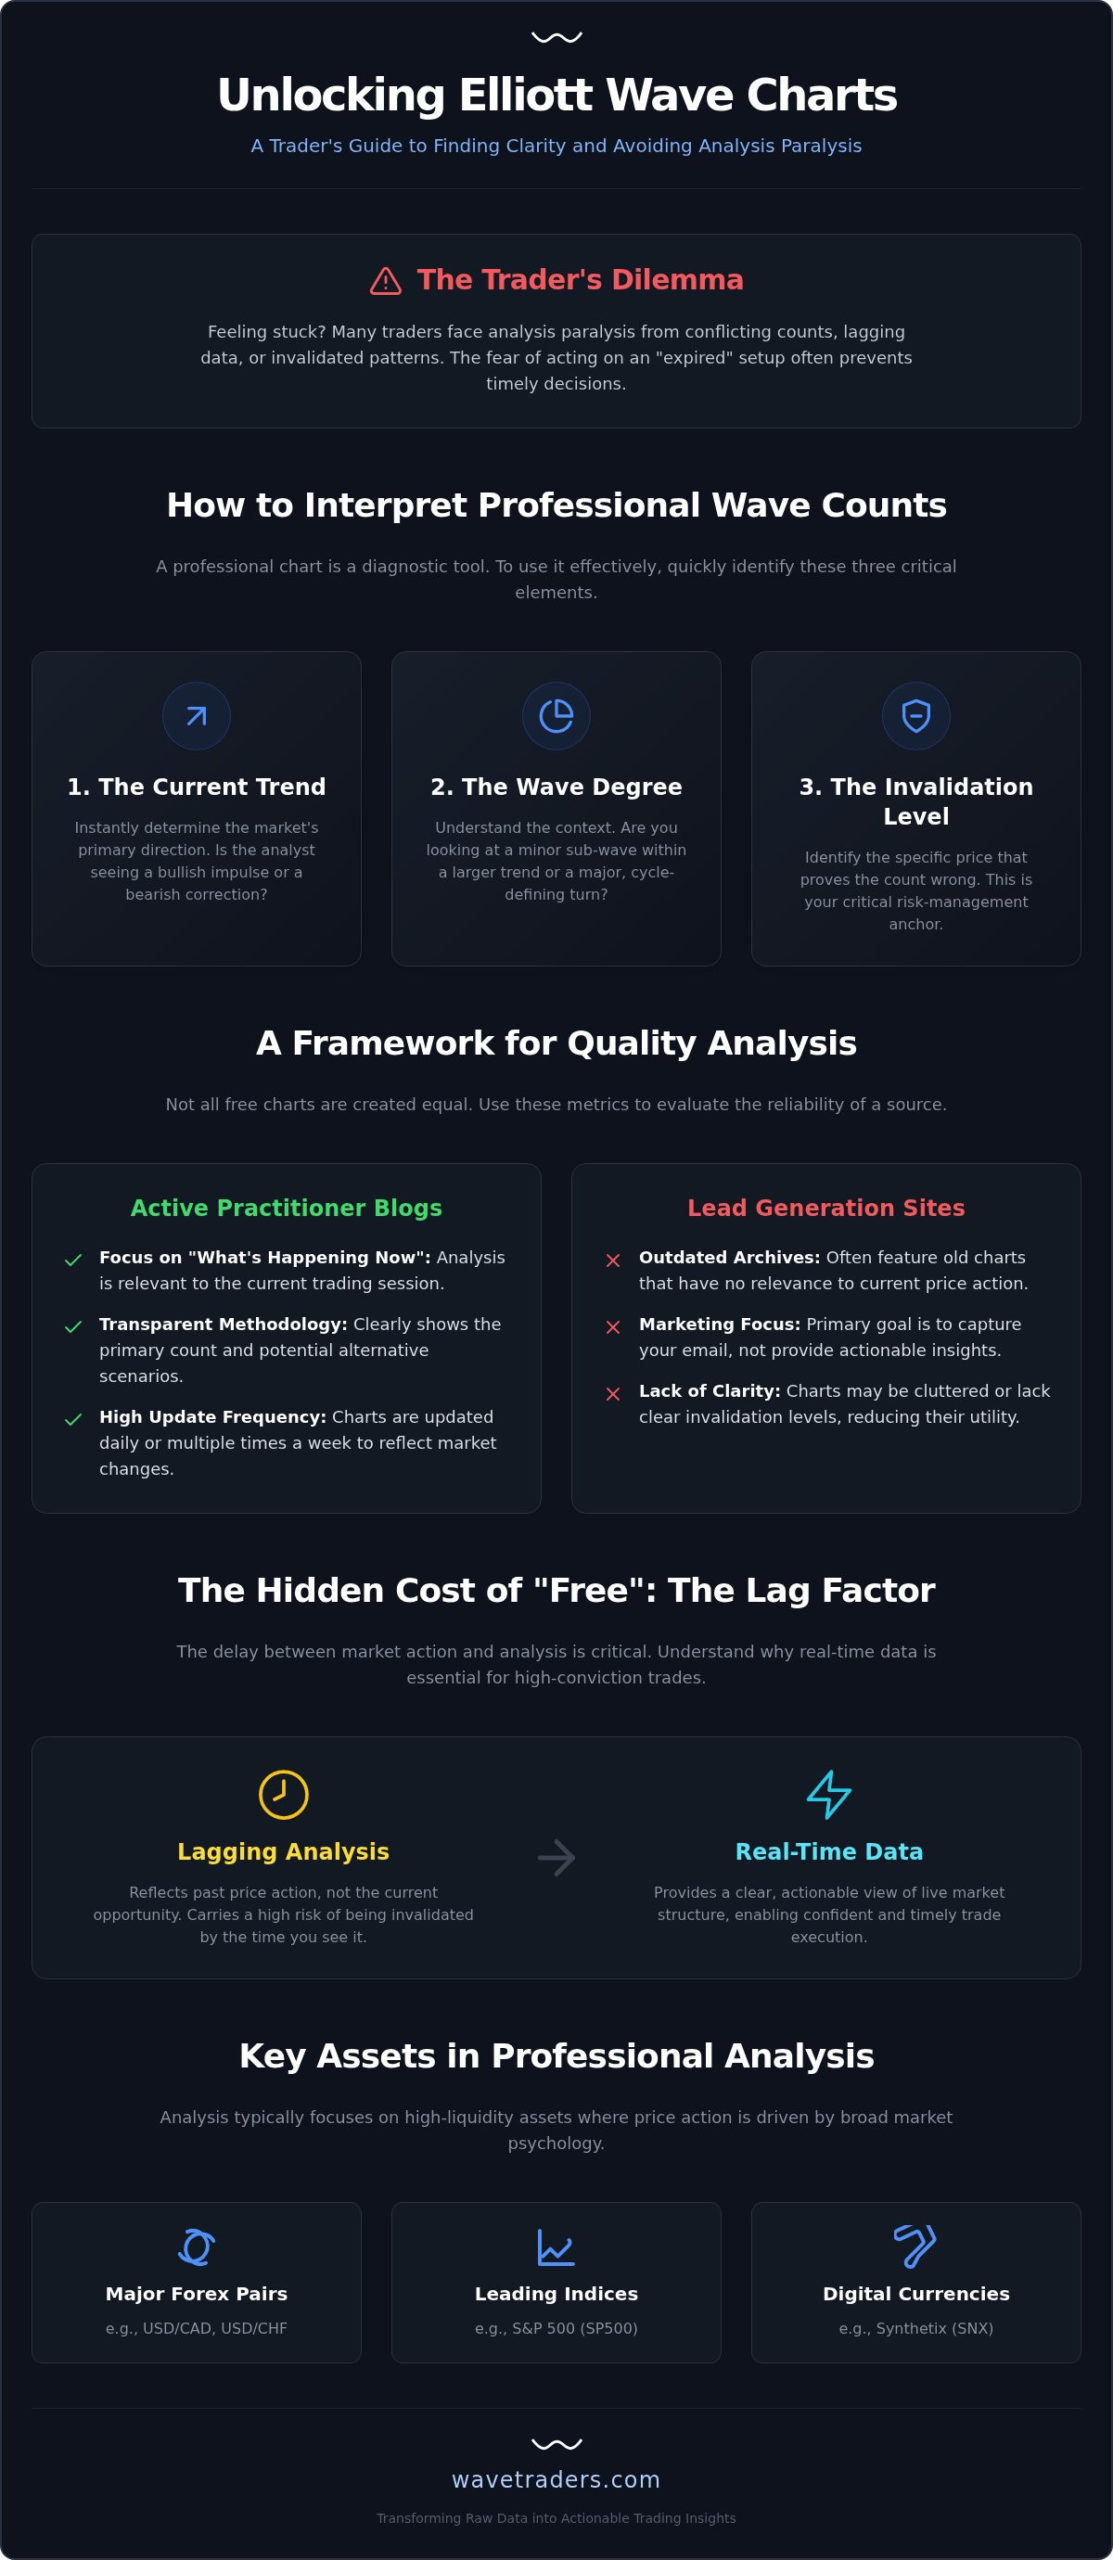
Could the very tool you’re using to find clarity in the markets be the primary source of your analysis paralysis? It’s a common frustration for many traders who search for free Elliott Wave charts only to find conflicting counts, lagging data, or patterns that have already been invalidated. You want to trust the structures you see on the screen, but the fear of entering a trade on an “expired” setup often keeps you from pulling the trigger.
We believe that finding a reliable starting point shouldn’t feel like a gamble. This guide identifies the most accurate sources for wave analysis in 2026 and explains how to use them as a transparent window into professional market logic. You’ll discover how to leverage these resources to validate your own trade setups and sharpen your counting skills without the stress of second-guessing every move. We’ll compare the top platforms for daily updates and show you how to turn a simple chart into a functional part of your trading routine.
Free Elliott Wave charts are professional market snapshots that provide a direct window into the mind of an experienced analyst. They aren’t just static lines on a screen. Instead, they represent a methodical interpretation of market psychology through price patterns. For many traders, these resources serve as a vital diagnostic tool to validate their own counts before they commit capital to a setup. By viewing a professional count, you can see how a practitioner applies theory to live data, which is often far more instructive than reading a textbook.
The practitioner-teacher model is central to why these resources exist. Analysts who have spent decades in the markets often share their work to foster a community of informed traders. It’s a way to demonstrate the methodology’s effectiveness while helping others learn to spot impulse waves or complex corrections. Unlike purely educational content that explains theory in a vacuum, these charts provide real-world application on current price action. They help distinguish between “educational” charts, which look at historical patterns, and “actionable” analysis that anticipates the next market move.
Most traders use these snapshots to check their own biases. If you see a bullish impulse wave forming but a professional count suggests a corrective flat is still in progress, it forces you to pause and re-examine your evidence. This process of cross-referencing is essential for avoiding emotional trading. During high volatility, seeing a calm, measured count from a seasoned pro provides a psychological anchor. It reminds you that the market is still following a structured path, even when it feels chaotic. These charts also act as a transparent trial run for a service. They allow you to see the quality of the analysis before deciding to join a more intensive program. To further assist in this validation process, tools like our Elliott Wave Calculator can be used alongside these charts to project potential targets based on Fibonacci ratios.
Free analysis typically focuses on high-liquidity assets that reflect broad market sentiment. These instruments are ideal for Elliott Wave analysis because their high volume ensures that price action is driven by collective psychology rather than isolated news events. At Wavetraders, we often provide snapshots for several key assets, including:
By following these specific assets, you can develop a feel for how different markets respect wave degrees and invalidation points. This regular observation builds the pattern recognition skills necessary for long-term success in the markets.
When you evaluate various sources for free Elliott Wave charts, the quality usually boils down to three specific metrics: update frequency, the clarity of annotations, and the variety of assets covered. A professional count isn’t just a drawing; it’s a piece of technical communication. If the labels are cluttered or the wave degrees are inconsistent, the chart loses its utility. Methodology transparency is the hallmark of a high-quality provider. You should be able to look at the chart and immediately identify the analyst’s primary view and their backup scenario.
There is a significant difference between institutional educational portals and active analysis blogs like Wavetraders. Institutional sites often provide deep historical archives, but their free content can feel disconnected from the current session. Active practitioner blogs focus on what’s happening right now. Most modern providers use high-performance, interactive charting interfaces that allow for clean, crisp labeling. This level of clarity is essential when you’re trying to distinguish between a minor sub-wave and a major cycle turn. Seeing a professional count on a clean, modern interface makes the transition from observation to execution much smoother.
It’s vital to distinguish between a lead generation site and a source of genuine market updates. Many websites offer free Elliott Wave charts primarily as a marketing tool to build an email list. These sites often feature an archive of old charts that no longer reflect current price action. If a provider doesn’t update their public counts during major market pivots, they aren’t offering a functional trading resource. A major red flag in amateur analysis is a count that lacks a clear invalidation level. Every professional setup must have a point where the thesis is proven wrong. If you’re tired of chasing outdated snapshots, exploring our active market analysis can help you stay aligned with the current trend.
Quality also varies significantly by asset class. For Forex traders, the best snapshots focus on high-liquidity pairs like EUR/USD or USD/CAD, where the wave structures are typically cleaner and respect Fibonacci levels more precisely. In the digital currency space, you need an analyst who understands the specific volatility profiles and extended waves common in Bitcoin or Ethereum cycles. Commodities like Gold or Oil require a top-down approach that respects higher-timeframe cycles. Finding a source that excels across these diverse markets ensures that your cross-market analysis remains consistent and reliable, helping you see how different assets are behaving within the broader global cycle.
Interpreting free Elliott Wave charts requires more than a passing glance at price targets. To truly benefit from professional analysis, you must understand the language of the labels. Professional counts use a standardized system of Roman numerals, numbers, and brackets to denote the hierarchy of the move. For instance, a circled Roman numeral “I” represents a much larger cycle than a lowercase “i” in parentheses. Wave degrees define the hierarchical position of a specific pattern within the larger market cycle. Without this understanding, you might mistake a minor intraday correction for a major trend reversal.
Every high-quality chart focuses on the “Big Three”: the trend, the wave degree, and the invalidation point. The trend tells you the path of least resistance. The degree explains the expected duration and magnitude of the move. The invalidation point is the most critical; it’s the price level where the current count is mathematically proven incorrect. Many traders ignore the contextual paragraph accompanying the chart, but this text often explains the “why” behind the count, offering clues about alternative scenarios if the primary view fails. Reading this text helps you follow the analyst’s logic rather than just blindly following a line.
Decoding symbols is the first step toward cycle mastery. Veteran analysts use specific brackets and circles to distinguish between a Grand Supercycle move lasting decades and a Subminuette move lasting hours. Understanding this degree is critical for timing your trade. If you’re an intraday trader, entering based on a Cycle-degree wave is a recipe for frustration. You need to cross-reference the higher-timeframe trend with the lower-timeframe execution. This top-down approach ensures you aren’t fighting a massive tide while trying to catch a small wave. Most professional charts will provide a legend or use standard notation that makes this hierarchy clear at a glance.
Professional charts are designed to highlight high-probability entry zones, typically found at the end of Wave 2 or Wave 4 pullbacks. These areas represent the “sweet spot” where risk is clearly defined against potential reward. Analysts often use base channels and trendlines to confirm that a correction is over and a new impulse is beginning. For a deeper look at how these cycles manifest in the world’s most liquid pair, our EUR/USD Elliott Wave Analysis provides a practical example of cycle mastery. By identifying where price should not go, you gain the confidence to stay in a trade as long as the count remains valid. This focus on invalidation levels is what separates professional analysis from mere guesswork.
A common question among developing traders is why they should invest in a subscription when free Elliott Wave charts are available across the web. It’s a fair point, but it overlooks the fundamental nature of the market: it’s a living, breathing entity. A free snapshot is essentially a historical document the moment it is published. While these snapshots are excellent for learning the theory and checking a general bias, they often fail to account for the “Lag Factor.” Markets move significantly faster than most blog posts can be updated, meaning the high-conviction setup you see on a free page might already be “expired” by the time you open your terminal.
Relying solely on static images also introduces the risk of static bias. This happens when a trader continues to hold a specific market view because their source hasn’t provided an update, even though price action has clearly invalidated the count. In professional trading, the ability to pivot is just as important as the ability to predict. Real-time analysis provides the necessary “course correction” that keeps you on the right side of the trend. It shifts the experience from passive consumption to active participation in a methodology that adapts as new price data arrives.
Volatility is the primary enemy of the static chart. Consider a scenario where a 5th wave extension occurs in a crypto pair or a major FX cross. If your chart is two days old, you might still be looking for a reversal while the market is in the middle of a massive blow-off top. Intraday updates are not a luxury for FX and Digital Currency traders; they are a requirement for managing risk. Membership services provide the granularity needed to see these shifts as they happen, ensuring your invalidation points are always current. If you’re ready to move beyond static snapshots, you can join our community for real-time market analysis and live updates.
The most significant limitation of free resources is the lack of interaction. You can see the count, but you can’t ask “why” the analyst chose a specific wave degree or how they are handling a complex correction. The best analysts prioritize their members during major market pivots, providing the reasoning behind a change in the count. This interaction is what facilitates the transition from being a simple “chart follower” to becoming a true wave practitioner. You learn to see the market through the eyes of an expert, which is a form of mentorship that static images simply cannot provide. It’s about building the skills to navigate uncertainty with confidence.
While free Elliott Wave charts provide an excellent foundation for understanding market direction, they represent only one piece of a successful trading strategy. To move from passive observation to consistent execution, you need a framework that combines high-quality data with the skills to interpret it. Just as traders depend on centralized market data, real estate professionals can discover WithEasement to access comprehensive property data and recorded easements in a single location. At Wavetraders, we’ve built an ecosystem designed to support traders at every stage of their journey, from the curious beginner to the professional looking to scale their capital. Our goal is to move you beyond simply following lines on a screen toward a deeper mastery of market structure.
One of the most effective ways to bridge the gap between a static chart and a live trade is through our Elliott Wave Calculator. This free tool allows you to input price data and automatically project Fibonacci targets for both impulse and corrective waves. It’s the ideal companion for those who use free charts but want to take the next step in validating their own analysis. By calculating potential turning points yourself, you develop a more intuitive feel for the methodology and gain confidence in your trade setups.
Our membership services are structured to provide specialized focus depending on the assets you trade. The FX Service offers daily precision for the world’s most liquid currency pairs, ensuring you always have a current view of the trend. For those navigating the high volatility of the crypto markets, our Digital Currency Service focuses on the unique cycle patterns found in digital assets. If your goal is ultimate self-sufficiency, the Elliott Wave School provides a comprehensive curriculum of video lessons. It’s designed to transform you from someone who follows counts into a practitioner who can identify opportunities with professional accuracy.
Scaling your trading often requires more than just knowledge; it requires access to capital and reliable infrastructure. We’ve partnered with established programs to offer our members a seamless path toward professional trading. Through our Eightcap program and broker referrals, you can set up a trading environment that matches the quality of your analysis. For those ready to manage larger accounts, we provide a 30% discount on the Funded Trader Program. This initiative allows you to leverage your wave counting skills to trade with professional-grade capital. We invite you to join the Wavetraders community, where we track the markets together and share the insights that lead to long-term success.
Using free Elliott Wave charts is a practical way to begin validating your market bias and learning the nuances of professional notation. However, as price action accelerates, the limitations of static snapshots become clear. To truly succeed, you need to transition from observing historical patterns to navigating live market pivots with confidence. This shift from passive follower to active practitioner is where real consistency is found.
Since 2003, Wavetraders has offered practitioner-led analysis designed to help traders master complex market structures. Whether you’re looking to refine your skills in our Elliott Wave School or want to scale your capital through our Funded Trader Program with a 30% discount, we provide the tools you need. It’s about more than just seeing the waves; it’s about knowing how to trade them. Start Your Journey with Wavetraders: Explore Our Membership Plans. We look forward to tracking the markets together and helping you reach your trading goals.
Specialized analysis blogs and practitioner-led sites are the most reliable sources for daily updates. Unlike large educational portals that often feature historical examples, these platforms focus on current market conditions for assets like the SP500 or major currency pairs. These free Elliott Wave charts provide a transparent look at how a professional analyst interprets the previous session’s price action to prepare for the coming day.
Free counts are excellent diagnostic tools, but they should be used to supplement, not replace, your own execution strategy. Because markets move quickly, a static snapshot can become “expired” if a key level is breached shortly after publication. They are best used for validating your bias or learning how to apply wave degrees. For live trading, real-time updates are essential to manage the “lag factor” inherent in blog-based analysis.
The best free tools are those that provide flexible labeling systems and precise Fibonacci measurement capabilities. Many high-performance web-based charting platforms offer the necessary drawing tools to apply Roman numerals and brackets manually. To complement these, the Elliott Wave Calculator is a vital resource for automatically projecting wave targets. It allows you to focus on pattern recognition while the tool handles the mathematical projections for wave extensions and retracements.
A chart is outdated the moment price action violates the labeled invalidation point. Every professional count should include a specific price level where the current thesis is proven incorrect. If the market has decisively broken that level, or if the time stamp on the analysis is several days old during a high-volatility period, the count likely requires a fresh interpretation to remain relevant to current conditions.
Elliott Wave analysis involves a degree of subjective interpretation within a strict set of objective rules. One analyst might see a complex correction as a double zigzag, while another interprets it as a developing triangle. This is why following a practitioner who explains their logic is so important. Seeing multiple valid counts helps you understand the “alternate scenarios” and prepares you to pivot if the primary count is invalidated.
While these charts can help you identify high-probability trend directions, passing a challenge requires intensive risk management that static images cannot provide. Evaluation programs often have strict drawdown limits that require precise, intraday timing. You can use free analysis to build your foundational bias, but you will likely need the granularity of real-time updates and professional mentorship to navigate the specific rules of a funded account evaluation.
Motive waves move in the direction of the larger trend and are typically labeled with numbers 1 through 5. They represent phases of high momentum and clear market progress. Corrective waves, usually labeled with letters A-B-C, move against the primary trend to partially retrace the previous motive move. Corrective phases are often more sideways and complex, serving as the “breather” before the market resumes its main impulse.
We provide regular snapshots of key instruments like USD/CAD, USD/CHF, and the SP500 as a proof-of-concept for our methodology. These updates are designed to show how our analysts handle real-world price action across different asset classes. While these public updates are frequent, our membership tiers offer the continuous, real-time granularity required for active traders who need to stay synchronized with the market’s internal wave structures throughout the trading session.
DISCLAIMER
Any reviews, news, analysis, prices or other information contained on our website is provided as general market commentary and delivered electronically through a distribution channel to larger number of clients, therefore does not constitute investment advice or investment research. We are not trading advisors. Most of our work is for educational purposes only, with information based on Elliott Wave theory in real time. Trading forex, futures, options, stocks, cryptocurrenices or any another trading market carries a high level of risk, and may not be suitable for all investors.
The possibility exists that you could lose some or all of your initial investment; therefore you should not invest money that you cannot afford to lose. Our website and the information that we provide should not be relied upon as a substitute for extensive independent research before making your investment decisions. In no event will we be liable for any loss or damage on your account in connection with, the use of our products. For any real cash investments you have to contact your financial advisor.
Any information or material contained on our website is owned by Val Global d.o.o.. Reproduction is prohibited without Val Global d.o.o. prior license in writing.
By continuing to use the site, you agree to the use of cookies. Learn more.
The cookie settings on this website are set to "allow cookies" to give you the best browsing experience possible. If you continue to use this website without changing your cookie settings or you click "Accept" below then you are consenting to this.