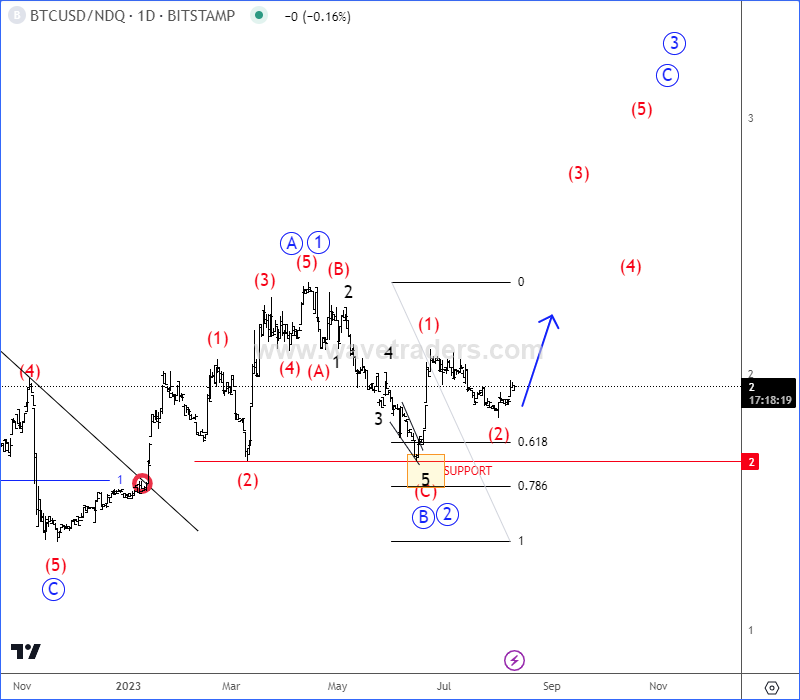
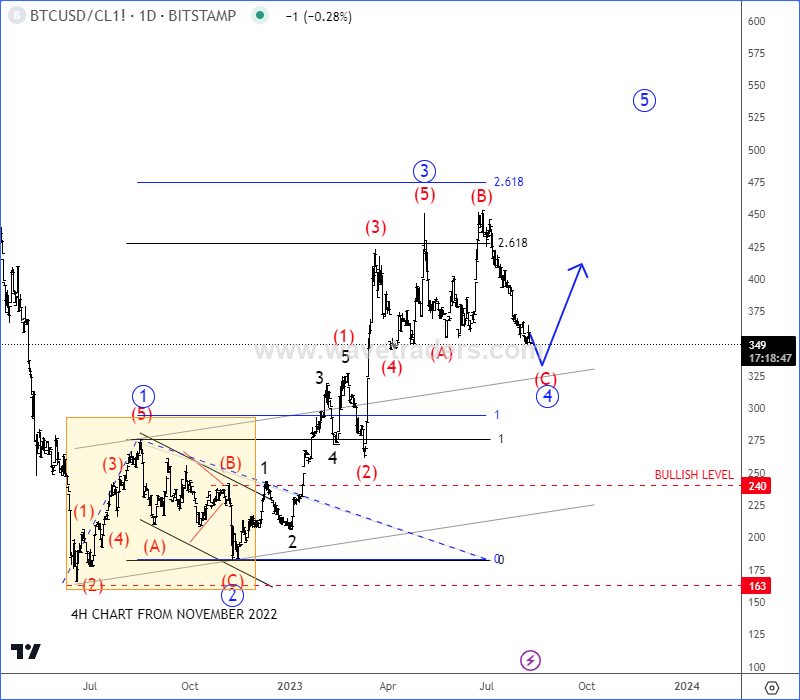
Bitcoin may outperform stocks and commodities, as ratio charts are showing bullish patterns from Elliott wave perspective.
Ratio charts are very important in the markets, because they are telling us, which market will be strongest or the weakest and which market may outperform another one.
We want to share two interesting ratio charts compared to Bitcoin. Our BTC/NASDAQ ratio chart, it’s still nicely on track and after recent pullback in wave (2), seems like it’s getting ready now for wave (3) of a five-wave bullish cycle within higher degree wave C/3. It’s telling us that Bitcoin may outperform stocks, specifically NASDAQ in upcoming weeks.

Another interesting ratio chart is BTC/OIL. While Crude oil is currently the strongest asset, we can see BTC/OIL ratio chart finishing a higher degree (A)-(B)-(C) correction within wave 4 and support can be near, ideally here at the former wave (4) area and base channel upper line. So, if we are on the right path, then Bitcoin can outperform commodities, specifically Crude oil as well and can send the ratio back to highs for the 5th wave.

Become a premium member
Get daily Elliott Wave updates for US Single Stocks, SP500,DAX, GOLD, SILVER, CRUDE, FX, CRYPTO, etc. or apply for unlimited access to the Elliot Wave educational videos.
Tesla Is Approaching Intraday Support. Check our free chart HERE.