When markets are trapped in a big range and traders are undecided about future moves, it can be challenging to determine the next potential direction. However, Elliott Wave Theory provides a framework for identifying patterns in market behavior, even in uncertain times.
According to Elliott Wave Theory, market trends move in a series of waves that are driven by the psychology of market participants. By identifying these waves and their patterns, traders can gain valuable insights into market trends and make more informed trading decisions.
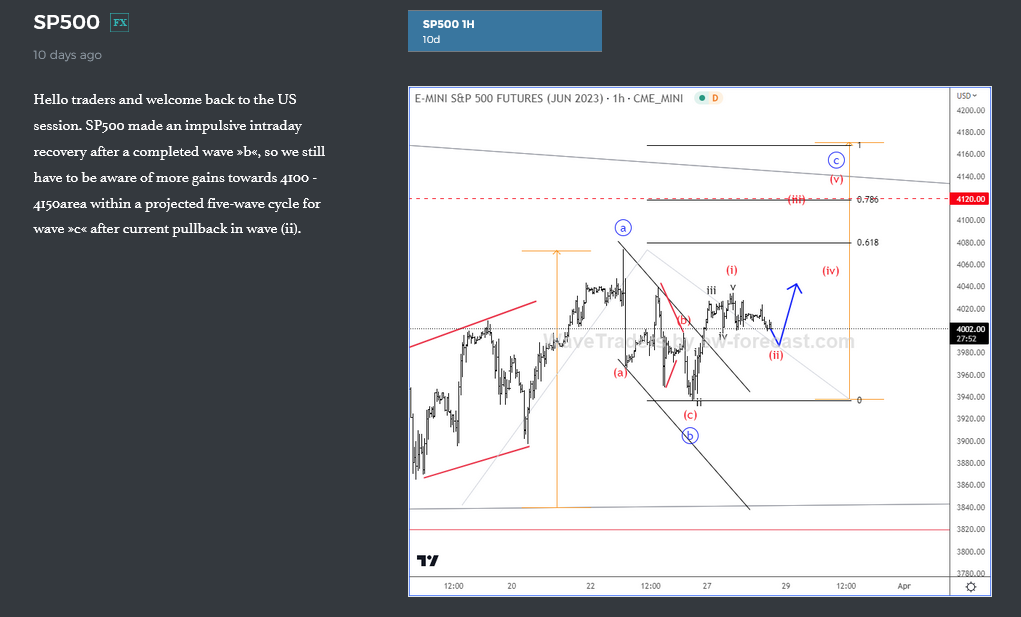
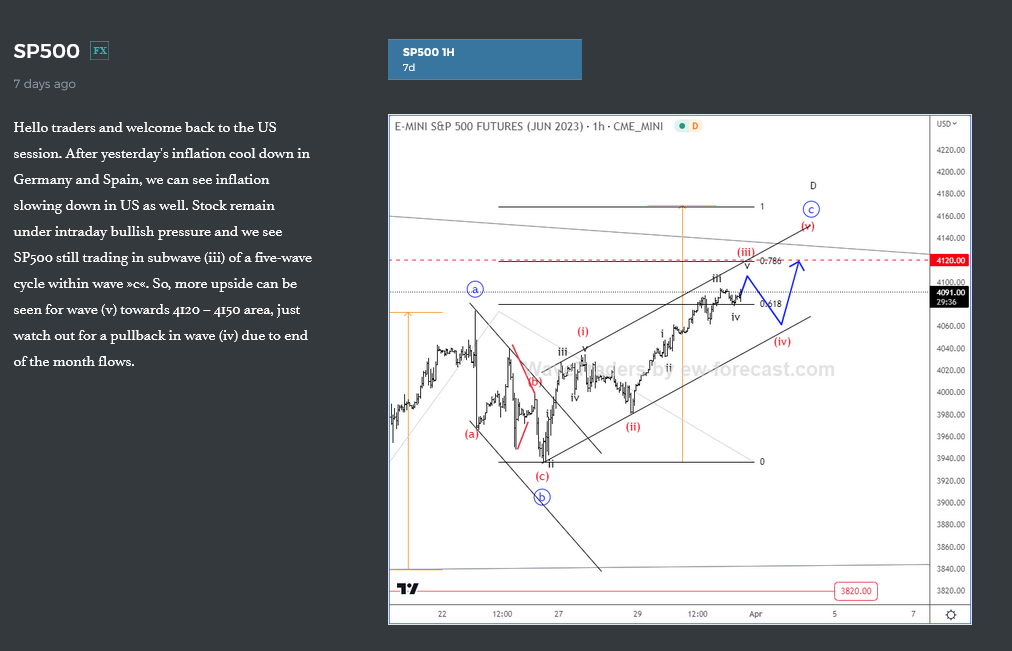
In the case of the SP500, on March 30th, a bullish reversal mode was identified on the hourly chart. Despite a three-wave drop from 4075, the corrective price action suggested a continuation higher, even if just temporarily for wave c. By tracking subwave (ii) of c and its bullish formation, the expectation was for a higher wave three.

As shown on the chart, the market subsequently resumed higher, confirming the anticipated bullish move. However, as the author notes, not all waves are as easy to predict as others, and it’s important to track markets that have clear structure and simple patterns.

The question is now, where we go from here? Well, sometimes some waves are much easier to predict than others. So as traders or investors is important to track and keep an eye on the markets that have very clear structure and simple pattern. Normally, when you can recognize the pattern and Elliott wave structure in just a few seconds after opening the chart, then surely, this market can be interesting to identify the next potential direction. By recognizing the patterns, traders can gain insights into potential market trends and make more informed trading decisions.
If you want to learn more about my perspective on the SP500 on a higher degree scale, check out the video. CLICK HERE
Trade well,
Grega
Aussie Is Looking For Lower Support. Check our free chart HERE