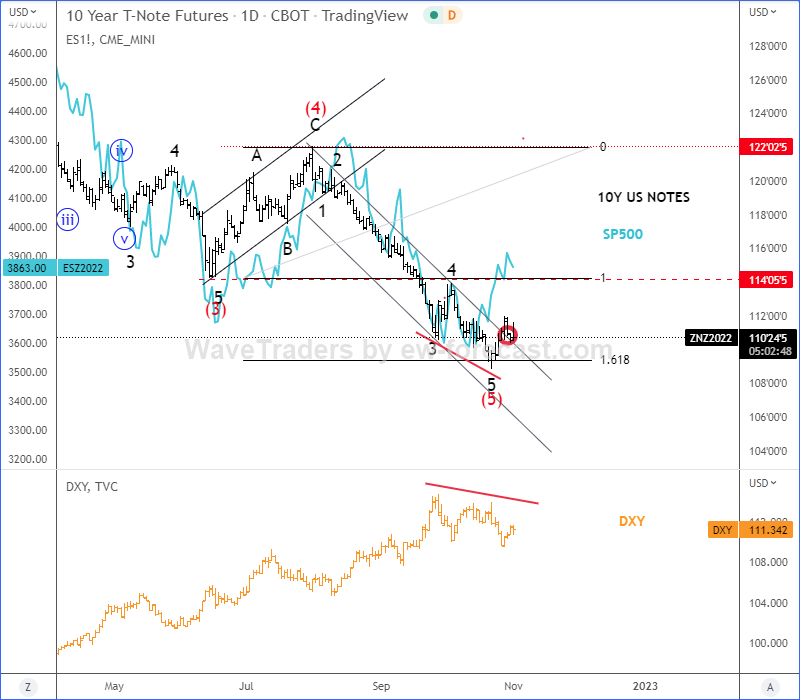
US Bonds may face a recovery, as we see 10Y US Notes chart finishing 5th wave from Elliott wave perspective.
Hello traders, today we will talk about US bonds, specifically 10Y US Notes chart, which is one of the main charts for the markets across the globe.
Bonds suffered a massive sell-off for the last two years and this is the main reason for strong US Dollar and bearish stocks. However, looking at the 10Y US Notes chart, we can see it finishing wave (5), which means that a recovery may not be far away, because we know that after every five waves, at least a three-wave retracement follows in Elliott wave theory.

If we compare 10Y US Notes chart with stocks (SP500) and USD Dollar (DXY), we can clearly see a positive correlation with the SP500, while DXY already shows a bearish divergence. Stocks are actually already recovering, so 10Y US Notes could easily follow to the upside, which may cause a resistance and a reversal down on DXY.
Technically speaking, if 10Y US Notes chart starts bouncing back above 114 level, then we can easily expect a bigger recovery back to the former wave (4) and 122 area.
Happy trading!
Interested in cryptocurrencies? DOGE bulls could be back. Check our chart HERE