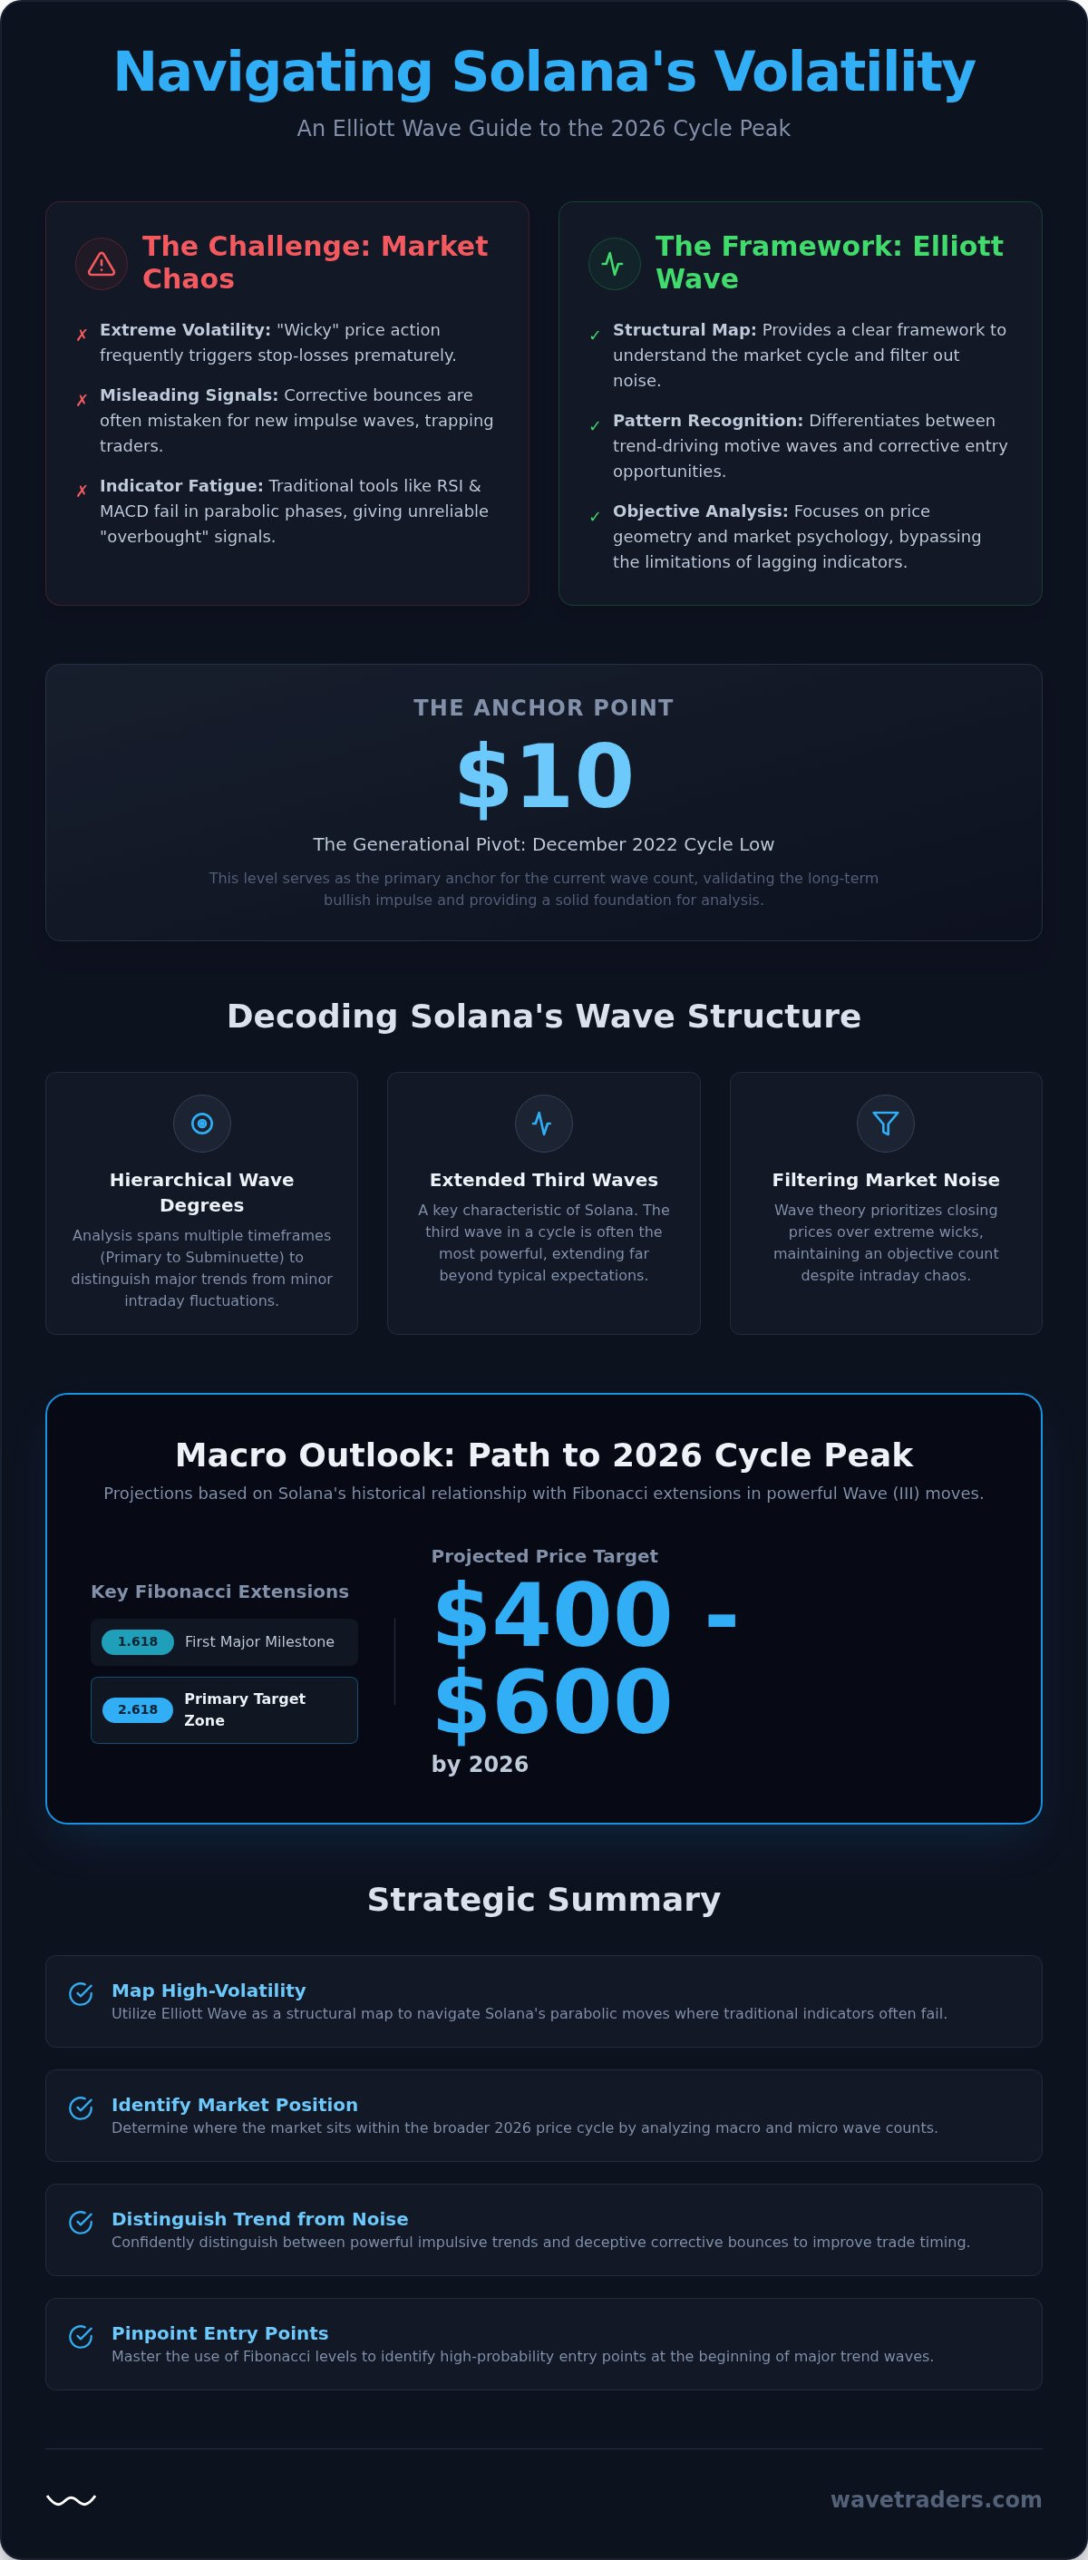
Is Solana’s extreme volatility a sign of market chaos or a roadmap for the disciplined trader? Many participants find themselves stopped out by the asset’s notorious “wicky” price action, often watching from the sidelines as a corrective bounce is mistaken for a new impulse wave. It’s frustrating to lose a position just before the market moves in your favor. However, once you apply a professional solana Elliott Wave analysis, these erratic movements begin to look like structured, predictable patterns. We understand that navigating such a high-velocity market requires more than just intuition; it requires a framework that accounts for the extended wave structures typical of this ecosystem.
In this guide, you’ll discover how to decode Solana’s price action to identify high-probability targets for the coming years. We’ll provide a clear, objective wave count that maps the path toward the 2026 cycle peak, offering concrete price levels for both entries and exits. By the end of this analysis, you’ll have the tools to distinguish short-term noise from the primary trend. We’re going to break down the Fibonacci ratios currently in play and establish a technical foundation that builds confidence in your long-term outlook.
Solana is often cited as one of the most volatile assets in the digital currency space. While this volatility attracts traders seeking high returns, it frequently leads to significant losses for those without a clear plan. A professional solana Elliott Wave analysis serves as a structural map for price action, providing a framework to understand where we are in the broader market cycle. Instead of guessing based on momentum alone, we categorize price movements into motive waves, which drive the trend, and corrective waves, which offer opportunities for entry during temporary retreats. This distinction is vital because it prevents traders from chasing the top of an exhausted impulse or selling during a healthy correction.
Traditional technical analysis tools like the Relative Strength Index (RSI) or MACD often struggle during Solana’s parabolic phases. These indicators can remain in overbought territory for weeks while the price continues to double or triple. This leads to indicator fatigue, where traders exit positions too early or attempt to short a runaway trend. Elliott Wave theory bypasses this limitation by focusing on the internal geometry and fractal nature of the trend. As we look toward the 2026 cycle peak, identifying the correct degree of the current wave is essential for setting realistic price targets and managing risk effectively. By understanding cycle degrees, we can distinguish between a minor pullback and a major trend reversal.
Intraday price action in Solana is notorious for wicky candles that can trigger stop-loss orders before the trend resumes. By using wave theory, we look past this noise to identify the underlying trend. We often prioritize closing prices over extreme wicks to ensure the wave count remains valid and objective. The Elliott Wave Principle is a law of market psychology that translates human emotion into recognizable price patterns. This psychological foundation helps us remain calm when the market appears chaotic.
Every reliable count needs a solid starting point. For Solana, the $10 low in December 2022 acts as a generational pivot. This level serves as the primary anchor, validating the long-term bullish impulse. When we compare this to Ethereum Elliott Wave analysis, we see similar recovery patterns, though Solana typically exhibits more aggressive extensions. Tracking these pivot points through a consistent solana Elliott Wave analysis allows us to maintain an objective view of the 2026 path.
To understand Solana’s trajectory, we must look at the market through multiple lenses simultaneously. On the weekly timeframe, the macro structure appears to be a developing five-wave impulse that originated at the 2022 lows. This large-scale move sets the stage for the next several years. However, a solitary view of the weekly chart isn’t enough. We use wave degrees, ranging from the Primary degree down to the Minute and Subminuette, to stay oriented within the trend. Without this hierarchical approach, it’s easy to mistake a minor intraday fluctuation for a major cycle top. A disciplined solana Elliott Wave analysis ensures that we don’t lose sight of the forest for the trees.
Solana has a distinct history of producing “Extended Third Waves.” In Elliott Wave theory, the third wave is typically the most powerful, but in the crypto space, these moves often stretch far beyond traditional expectations. We’ve seen Solana consistently push through standard resistance levels as momentum feeds on itself. This characteristic makes it a favorite for trend followers, yet it requires a precise count to avoid entering at the tail end of an extension. By tracking these internal sub-waves, we can identify when the “engine room” of the trend is truly active. For a broader perspective on how these dynamics play out across the entire digital asset space, our altcoin Elliott Wave analysis provides essential context on how Bitcoin dominance and individual project cycles interact heading into 2026.
When we project the current motive leg, we look for key Fibonacci clusters. The 1.618 extension is our first major milestone, but Solana frequently targets the 2.618 level during bullish cycles. Based on the current trajectory, these extensions point toward a path into the $400 to $600 range by 2026. This isn’t just a hopeful guess; it’s a projection based on the asset’s historical relationship with Fibonacci ratios. Solana often exceeds these targets when market sentiment reaches a fever pitch, so we monitor these levels as areas of potential interest rather than rigid ceilings.
On the daily chart, the most common challenge for traders is the Wave 4 consolidation. These patterns are sideways, frustrating, and designed to shake out weak hands. A Wave 4 often looks like a trend reversal because it breaks through local support levels, yet it’s merely a pause before the final Wave 5 impulse. We often see SOL’s Wave 4 align with broader Bitcoin cycle consolidations, creating a period of market-wide uncertainty. If you’re looking for clarity during these choppy periods, our Digital Currency Service provides real-time updates to help you stay on the right side of the count.
Distinguishing a correction from a total trend reversal is the hallmark of an experienced practitioner. We look for specific three-wave structures within the correction to confirm that the larger bullish impulse remains intact. Once the Wave 4 completes its deceptive sideways move, the stage is set for the next leg higher. Tracking these micro-movements allows us to refine our entries before the market realizes the correction has ended.
Understanding the distinction between motive and corrective waves is the key to mastering solana Elliott Wave analysis. Motive waves are the “engine room” of the trend, consisting of five distinct sub-waves that drive price in the primary direction. In Solana’s ecosystem, these motive waves are characterized by intense momentum and rapid price appreciation. Conversely, corrective waves are three-wave structures that move against the trend. While they look like reversals to the untrained eye, they’re actually necessary pauses that allow the market to reset before the next leg higher. Recognizing these phases helps traders avoid the emotional fatigue that comes from reacting to every minor price swing.
Solana’s corrective patterns often follow specific forms like Zig-Zags, Flats, or Triangles. A unique trait of SOL is that its corrections are frequently shallow but extremely fast. This can be jarring for traders who expect a deep retracement and end up missing the next move because the market didn’t wait for them. We also apply the “Alternation Rule,” which suggests that if Wave 2 was a sharp and deep Zig-Zag, Wave 4 is likely to be a complex, sideways pattern. This structural variety is why a disciplined approach is required to stay aligned with the dominant trend. By anticipating the style of correction, you can better prepare for the eventual breakout.
To identify an impulse, we follow strict rules that define the structure’s validity. For instance, Wave 2 must never retrace more than 100% of Wave 1. If it does, the count is invalidated and we must re-evaluate the starting point. In Solana’s price history, Wave 3 is almost always the strongest and longest segment, showing the most vertical price action and highest volume. The Third Wave represents the most profitable segment for traders due to its sustained momentum and high-volume participation.
Wave 4 is often the most deceptive phase because sentiment turns bearish just as the market prepares for its final push. We frequently see a “B-wave fakeout” within these corrections, where a brief rally tricks traders into thinking the impulse has resumed, only for a final C-wave drop to follow. This behavior is quite similar to the structures we track in our XRP Price Elliott Wave Analysis, where sideways frustration often precedes a breakout. By pairing sentiment analysis with a precise solana Elliott Wave analysis, you can avoid these traps and wait for the high-probability Wave 5 setup to emerge.
Executing trades on Solana requires moving beyond the “buy and hold” mentality into a structured approach based on market geometry. We focus on finding the “sweet spot,” which typically occurs at the inception of a Third Wave or a Fifth Wave. These are the segments where the trend exhibits the most clarity and momentum. The Third Wave is defined as the most profitable segment for traders due to its tendency to produce the largest price moves. A professional solana Elliott Wave analysis identifies these entry points by looking for completed three-wave corrective structures. Instead of reacting to price spikes, we wait for the market to come to our predetermined Fibonacci levels.
Timing these entries involves monitoring the 0.382, 0.5, and 0.618 retracement zones. In the fast-moving Solana ecosystem, Wave 2 corrections often reach the deeper 0.618 level, while Wave 4 corrections tend to be shallower, often finding support near the 0.382 mark. By placing orders within these zones, you can participate in the trend with a clearly defined risk-to-reward ratio. This methodical entry process is what separates a practitioner from a gambler. Using a disciplined solana Elliott Wave analysis allows us to set objective stop-losses just below the invalidation point of the wave structure.
Profit-taking is an area where many traders struggle, often exiting too early or holding through a major reversal. We solve this by identifying Fibonacci clusters, which are zones where extensions from different wave degrees overlap. These clusters represent significant confluence and act as high-probability “take-profit” targets for SOL. In the crypto markets, price often “over-extends” into the 1.236 extension before finding a peak. Recognizing these zones allows you to scale out of positions objectively as the market reaches its projected exhaustion points.
The most important part of any strategy is knowing when the thesis is no longer valid. In Elliott Wave theory, we have “hard rules” that provide absolute invalidation levels. For instance, if a price move retraces more than 100% of the previous wave, the count is broken. This clarity allows you to pivot your strategy immediately rather than staying stuck in a losing trade. Having an objective exit plan removes the anxiety of uncertainty and protects your capital for the next setup. To see how we map these invalidation levels in real-time, you can follow our Digital Currency Service for updated counts.
Navigating the 24/7 digital currency markets is a demanding pursuit that often leads to burnout for the unguided trader. Professional oversight helps maintain the objectivity required to stick to a plan when volatility spikes. Our Digital Currency Service is designed to provide this stability by tracking SOL in real-time through a disciplined solana Elliott Wave analysis. This service moves you beyond the role of a simple signal follower; it encourages you to become an analytical trader who understands the “why” behind every price target. There is also a powerful synergy between this methodology and our Funded Trader Program, where disciplined practitioners can apply their skills to manage larger capital pools once they’ve proven their consistency.
We believe that the best traders are those who never stop learning. By integrating our tools with your daily routine, you begin to see the market as a series of repeating psychological patterns rather than a chaotic sequence of events. This shift in perspective is what allows you to survive the drawdowns and capitalize on the extensions that Solana is known for. Our goal is to walk alongside you as you develop this expertise and refine your own solana Elliott Wave analysis over time.
Members receive access to live wave counts for the major assets, including Solana, Bitcoin, and Ethereum. Having practitioner-teacher insights during moments of market stress is invaluable for keeping a steady hand and avoiding emotional decisions. Broadening your view to other sectors, such as the EUR/USD Elliott Wave Analysis, can also provide clues about the broader macro environment and how global liquidity flows might impact the crypto ecosystem.
Structured education is the most efficient way to master a complex framework like wave theory. While many try to piece together a strategy from scattered online videos, the Elliott Wave School offers a methodical progression from foundational basics to advanced execution. You’ll learn to master the Elliott Wave Calculator, which allows for precise Fibonacci targeting instead of relying on visual guesswork. This training provides the technical edge needed to identify high-probability setups with confidence. If you’re ready to transition from observation to professional expertise, apply for the Elliott Wave School today and join a community of serious practitioners.
Solana’s price action doesn’t have to be a source of frustration. By adopting a disciplined solana Elliott Wave analysis, you move from reacting to volatility to anticipating structural shifts. We’ve explored how identifying the macro count from the 2022 lows and recognizing deceptive Wave 4 consolidations provides a roadmap that traditional indicators simply cannot match. Success in this market comes down to distinguishing the motive trend from the noise and executing with objective Fibonacci targets. It’s about staying focused on the larger cycle while managing the intraday wicks with precision.
In addition to tracking market cycles, staying informed about the broader digital ecosystem can provide valuable perspective; for instance, you can check out OohYeah! to see how new platforms are revolutionizing the way fans support artists directly.
Since 2003, Wavetraders has provided practitioner-led analysis with a professional, no-hype methodology. We offer tiered membership options tailored for every skill level, ensuring you have the support you need as the market evolves. You don’t have to track these complex extensions alone or second-guess your entries during periods of high stress. Start your Elliott Wave journey with Wavetraders’ Digital Currency Service and gain the clarity needed to navigate the next major cycle with confidence. The market is always moving; let’s track it together.
The current count suggests Solana is progressing through a primary degree five-wave impulse that originated at the December 2022 lows. This macro structure points toward a projected cycle peak in the $400 to $600 range by 2026. This outlook remains the primary thesis as long as the market continues to respect the structural support levels established during the early stages of the trend.
Elliott Wave theory identifies high-probability price paths by mapping the recurring patterns of market psychology. It doesn’t predict the future with absolute certainty; instead, it provides a structured framework for managing risk and setting objective targets. By using a professional solana Elliott Wave analysis, traders can identify specific levels where their thesis is wrong, allowing them to exit positions before significant capital is lost.
Fibonacci extensions help project the length of motive waves, specifically the third and fifth waves in a sequence. We look for confluence between different wave degrees, often targeting the 1.618 or 2.618 extensions during impulsive rallies. In the crypto markets, it’s also important to monitor the 1.236 extension, as Solana frequently produces “over-extensions” during the most parabolic phases of its cycle.
A frequent error is mistaking a complex Wave 4 correction for a total trend reversal, which leads traders to exit winning positions too early. Many participants also struggle because they ignore wave degrees, confusing short-term intraday noise with the primary trend. Relying too heavily on extreme candle wicks rather than closing prices can also result in an inaccurate count that doesn’t reflect the underlying psychological trend.
From a macro perspective, Solana appears to be within the powerful extension of a third wave. While smaller sub-waves on the daily or hourly charts may be undergoing corrections, the larger motive structure suggests the cycle hasn’t yet reached its final exhaustion point. Distinguishing between these different degrees is essential for maintaining a clear perspective on the path toward the 2026 peak.
Invalidation occurs when price action violates a fundamental rule, such as Wave 2 retracing more than 100% of Wave 1. This event is actually a useful tool for the disciplined trader because it provides an objective signal to pivot or exit a position. When a count breaks, we re-evaluate the market structure from the last valid pivot point to identify the new high-probability path.
Solana’s wave structure is typically more aggressive than Bitcoin’s, often featuring more vertical extensions and faster trend resumptions. While both assets generally follow the same broader market cycle, Solana tends to exhibit higher volatility and shallower corrective phases. This means that solana Elliott Wave analysis requires a specific focus on “extended” structures that might look overextended by traditional Bitcoin standards. Traders who want to place Solana’s behavior within the wider digital asset landscape will find that a comprehensive altcoin Elliott Wave analysis reveals how Solana’s aggressive extensions compare to other high-beta projects competing for capital rotation in the 2026 cycle.
While it’s possible to track waves independently, a professional service provides the oversight needed to navigate a 24/7 market. Our Digital Currency Service offers real-time updates and practitioner-led insights that help traders filter out emotional noise. This support is particularly valuable during high-volatility events when the market’s structure can change rapidly, requiring a quick and objective re-count of the sub-waves.
DISCLAIMER
Any reviews, news, analysis, prices or other information contained on our website is provided as general market commentary and delivered electronically through a distribution channel to larger number of clients, therefore does not constitute investment advice or investment research. We are not trading advisors. Most of our work is for educational purposes only, with information based on Elliott Wave theory in real time. Trading forex, futures, options, stocks, cryptocurrenices or any another trading market carries a high level of risk, and may not be suitable for all investors.
The possibility exists that you could lose some or all of your initial investment; therefore you should not invest money that you cannot afford to lose. Our website and the information that we provide should not be relied upon as a substitute for extensive independent research before making your investment decisions. In no event will we be liable for any loss or damage on your account in connection with, the use of our products. For any real cash investments you have to contact your financial advisor.
Any information or material contained on our website is owned by Val Global d.o.o.. Reproduction is prohibited without Val Global d.o.o. prior license in writing.
By continuing to use the site, you agree to the use of cookies. Learn more.
The cookie settings on this website are set to "allow cookies" to give you the best browsing experience possible. If you continue to use this website without changing your cookie settings or you click "Accept" below then you are consenting to this.