Why does a perfect five-wave move on your one-minute chart often lead to a loss when you zoom out to the daily view? It’s a common frustration for many practitioners who find themselves overwhelmed by complex labeling symbols or inconsistent counts when switching chart views. You’ve likely felt the sting of getting lost in the noise of lower timeframes, unsure if the move you’re tracking is a minor correction or the start of a multi-year trend. Having a clear Elliott Wave degree explained is the only way to solve this confusion; it acts as the GPS for your technical analysis.
I understand how intimidating the hierarchy of cycles can feel at first, but mastering these fractals is what separates a guessing trader from a confident analyst. In this article, you’ll learn how to categorize market cycles correctly and align your trading across multiple timeframes with precision. We’ll walk through the official hierarchy of wave degrees, provide a clear guide for labeling your charts, and show you how to perform multi-timeframe analysis that actually makes sense. By the end, you’ll have the tools to look at any chart and know exactly where you stand in the broader market structure.
The market isn’t a chaotic mess of price ticks. It’s a structured, repeating pattern of human behavior. To trade it effectively, you need a way to organize what you see on your screen. That’s where having an Elliott Wave degree explained properly becomes your most valuable tool. At its core, a degree is a notation system used to identify a wave’s position within the larger market hierarchy. It tells you if you’re looking at a minor ripple or a massive tidal wave.
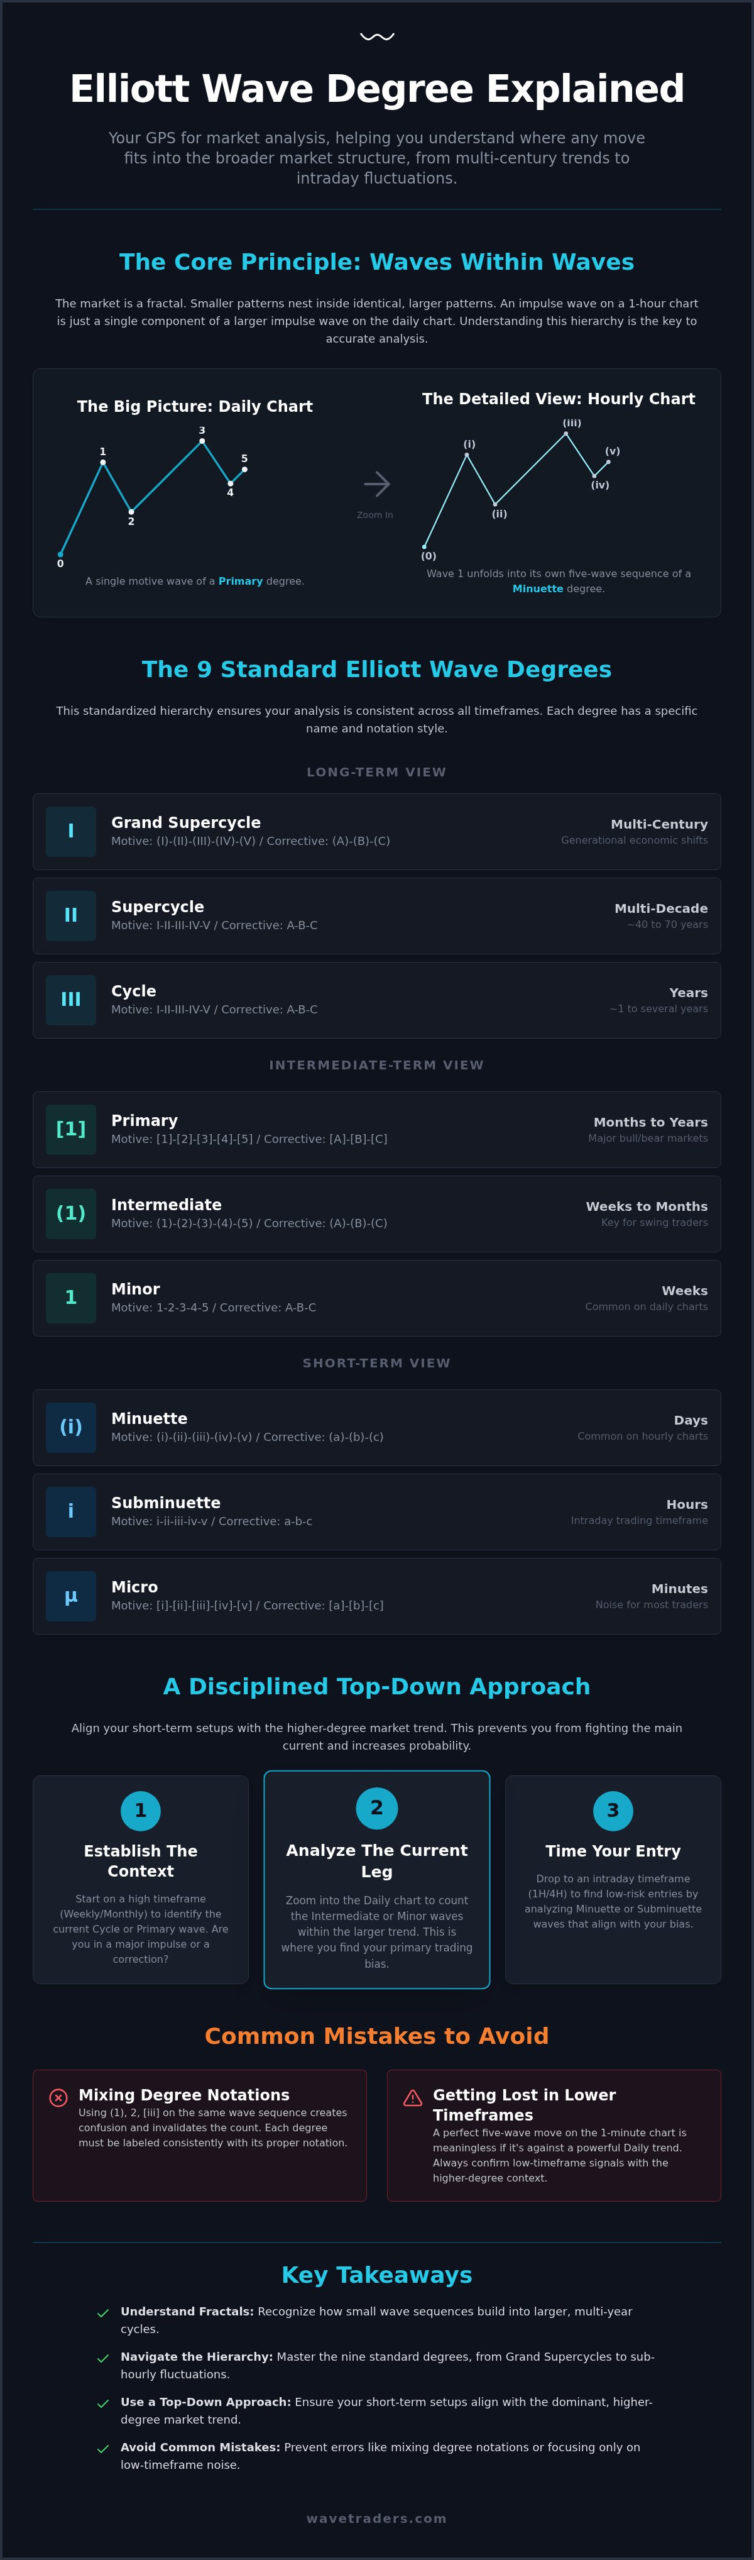
This system is built on the concept of fractals. In the Elliott Wave Principle, we observe that small five-wave sequences build into larger five-wave sequences. This happens infinitely. Think of it like a digital map; you can look at the entire continent or zoom in on a single street. Both views are accurate, but they serve different purposes. By using degrees, you prevent analysis paralysis because you always know which map you’re currently reading. It provides a structured path through the noise.
Each degree also reflects a different level of market psychology. A Grand Supercycle represents the collective mood of multiple generations, while a Subminuette might represent the panic or greed of a single afternoon. Understanding this shift is vital. You wouldn’t expect a one-minute spike to change a decade-long trend, yet traders often make the mistake of treating every wave as if it has the same psychological weight. Recognizing the degree helps you align your expectations with the market’s current reality.
Visualizing the 5-3 structure as a single component of a larger degree is the first step toward mastery. Imagine a single Motive wave on a weekly chart. To a long-term investor, it looks like a single move. However, if you drop down to the daily chart, that same line unfolds into a full five-wave sequence. This is the essence of waves within waves. It’s crucial to maintain proportionality here. If your wave two correction takes three months, your wave four shouldn’t be over in two hours. They must look like they belong to the same degree to be valid.
Many newcomers think degree is strictly defined by time, such as one week equals one degree. This isn’t quite right. While time is a factor, Elliott Wave Degree is a relative measurement of market cycles based on their size and duration within a hierarchical structure. Price magnitude often helps us distinguish between a Minuette and a Minor wave more accurately than time alone. If a move covers a significant percentage of the asset’s value, it’s likely a higher degree than a move that only covers a fraction of that distance. Magnitude and time work together to reveal the wave’s true rank.
Organization is the foundation of any successful wave count. Without a standardized system, the fractal nature of the market would be impossible to track. The 9 standard degrees provide this structure, moving from multi-century economic shifts down to the smallest price fluctuations. Having the Elliott Wave degree explained through these specific labels ensures that your analysis remains consistent as you switch between a monthly chart and a five-minute view.
Labeling isn’t just about the name; it’s about the visual symbol. Standard conventions use a mix of Roman numerals, Arabic numerals, circles, and brackets. For instance, higher degrees often use uppercase Roman numerals, while lower degrees shift to lowercase or Arabic numbers. This visual shorthand allows a seasoned analyst to identify the context of a wave at a glance. If you’re finding these labels complex, practicing with our Free Charts can help you see these conventions applied in a live market environment.
These degrees provide the “big picture” context that every trader needs, even if they only trade intraday. The Grand Supercycle (I) spans centuries and is typically reserved for historical analysis of major stock indices. Moving down, the Supercycle ((I)) covers multi-decade waves that define entire economic eras, such as long-term commodity cycles. Finally, the Cycle (I) degree is highly relevant for long-term investors, as these waves often last several years and represent major bull or bear markets.
This is where most swing traders spend their time. The Primary degree [1] consists of waves that last from several months to a few years. It’s the “bread and butter” for those looking to capture significant market trends. Within these, we find Intermediate (1) waves, which define the primary trends within a single trading year. Finally, Minor 1 waves are the building blocks you’ll see most clearly on daily and 4-hour charts; they provide enough detail for active trading without the excessive noise of lower timeframes. For a practical example of how these Intermediate and Primary degree labels appear on a major currency pair, see our EUR/USD Elliott Wave analysis covering the 2026 market cycle.
For those focused on execution and intraday movements, the short-term degrees are essential. The Minute degree i is ideal for identifying trends on 1-hour charts. As we zoom in further, the Minuette (i) degree provides the granularity required for precise entry and exit timing. The smallest recognized level is the Subminuette i, often visible on 1-minute to 5-minute charts. While these degrees are fast-moving, they must still follow the same rules as their larger counterparts. Understanding the 3 rules of Elliott Wave is especially critical at these lower degrees, where violations are easier to miss and more costly to ignore.
Mastering the theory of cycles is a significant step, but applying that knowledge to live charts requires a disciplined methodology. The most effective way to navigate the markets is through a top-down approach. You should always start with the largest visible degree on your weekly or monthly charts before zooming in to find an entry. This macro view ensures you don’t accidentally trade against a massive trend while focused on a small intraday setup. Having the Elliott Wave degree explained in this practical context means understanding that a Minor wave correction is often just a high-probability buying opportunity within a larger Primary wave trend. Recognizing whether that correction takes the form of a sharp Elliott Wave zigzag pattern or a sideways flat structure is critical for setting accurate price targets and stop levels.
Your chosen degree also defines your trading horizon, which is how long you can reasonably expect to hold a position. If you identify a setup at the Intermediate degree, you’re looking at a trade that may last weeks or even months. Conversely, a Minute degree trade might only span a few days. To stay organized, we suggest following the “Rule of Three.” This involves keeping track of the degree you’re trading, the degree immediately above it for context, and the degree immediately below it for timing. This simple framework prevents you from getting lost in the noise of lower timeframes.
To keep your charts clean and logical, you must align specific degrees with appropriate timeframes. Daily charts are generally the best home for Primary and Intermediate labels. When you move down to the 4-hour chart, you’ll find the Minor and Minute waves provide the best clarity. For those focusing on 15-minute or 5-minute charts, the Minuette and Subminuette degrees are most appropriate. You should be careful to avoid “degree creep,” which is the common mistake of labeling a small 5-minute squiggle as a high-level Intermediate wave. A Primary wave 3, for instance, must contain five distinct Intermediate waves that are proportional in both price and time. Traders applying this top-down framework to the FX market will find our eurusd elliott wave analysis for the current 2026 cycle a useful real-world reference for how degree mapping translates to live currency charts.
Precision in labeling isn’t just about where the lines go; it’s about the mathematical relationship between the waves. Our proprietary tools help you validate your counts by checking price-to-time ratios and Fibonacci targets. For example, if a wave you’ve labeled as “Minor 3” hasn’t reached the typical 1.618 extension of wave 1, the calculator might suggest your degree identification is premature. You can try our Elliott Wave Calculator to verify your counts and ensure your labels meet the strict guidelines of the methodology. This level of verification builds the quiet confidence needed to execute trades in volatile markets.
Even with the Elliott Wave degree explained in detail, many traders struggle when they move from theory to live charts. The most frequent error is mixing degrees. For example, a trader might label an impulsive wave 1 as Primary and the subsequent wave 2 correction as Minute. This is a logical impossibility because a wave 2 must be of the same degree as the wave 1 it corrects. Such inconsistencies lead to “broken” counts that eventually result in trading losses.
Another common pitfall is over-labeling the “noise” in the Subminuette degree. It’s easy to get lost in every five-minute squiggle, but without higher-degree context, these labels are often meaningless. You might also find yourself ignoring the “Rule of Alternation.” This rule suggests that if wave two is a sharp correction, wave four will likely be sideways. Knowing how to identify a sharp corrective structure — such as the 5-3-5 Elliott Wave zigzag pattern — helps you apply this rule correctly and avoid misidentifying the current market position across all degrees. This principle applies across all degrees, and overlooking it often leads to misidentifying the current market position.
The psychological trap of “degree bias” is equally dangerous. This occurs when a trader sees a “Grand Supercycle” crash in every five-minute dip or expects a multi-year bull market to start from a small intraday bounce. Keeping your perspective grounded in the degree you are actually trading is essential for maintaining emotional balance. It helps you avoid the anxiety of treating every minor fluctuation as a major trend change.
Signs that your degree labeling is inconsistent often appear when price action refuses to follow the expected path. If a wave 3 is shorter than wave 1 and wave 5, your count is likely invalid. When this happens, it’s time to zoom out and re-evaluate the higher-degree structure. Identifying clear “Invalidation Levels” across different degrees helps you recognize when a count is wrong before it impacts your capital. If price breaks a level that should remain intact for a specific degree, you must accept the evidence and adjust your labels accordingly. A thorough understanding of the 3 rules of Elliott Wave gives you the objective framework to determine exactly which invalidation levels matter most at each degree.
Critics often argue that Elliott Wave is subjective, claiming analysts simply see what they want to see. However, strict degree rules turn these patterns into objective trading plans. By adhering to the hierarchy and symbols we’ve discussed, you remove the guesswork. Degree errors are the #1 cause of failed Elliott Wave forecasts. If you’re ready to move beyond guesswork, you can join our Elliott Wave School to see how professionals maintain objective counts in real-time.
Developing the ability to identify wave degrees independently is the ultimate skill for any technical analyst. While it’s helpful to have the Elliott Wave degree explained in theory, the real challenge lies in applying those labels to a volatile live market. At Wavetraders, we believe that a trader who can count for themselves is a trader who can navigate any economic environment. This transition from passive observer to active practitioner is what our educational programs are designed to facilitate.
Our real-time FX and Crypto services provide a daily laboratory where you can see these degrees in action. By watching how we label major currency pairs or digital assets—which are explored in detail at Cryptora Institute—you begin to recognize the subtle differences between a corrective bounce and a new trend. This isn’t just about following an alert; it’s about understanding the underlying logic. Engaging with a community of seasoned practitioners allows you to compare your wave degrees with others, refining your perspective and catching potential errors in a collaborative setting.
The journey to mastery requires a step-by-step approach that breaks down complex concepts into manageable pieces. Our video lessons are structured to guide you through the nuances of labeling, starting with simple structures and moving toward complex “nested” waves. Seeing a professional analyst handle these intricate patterns helps you understand how to maintain proportionality and logic even when the price action looks messy. If you’re ready to build a solid foundation, you can Apply for the Elliott Wave School to begin your training.
Applying the theory of degrees to assets like Bitcoin, Forex, and major Indices is where the methodology proves its worth. When you know exactly which degree is currently in control of the price action, your trading anxiety naturally decreases. You’re no longer guessing if a dip is a buying opportunity or the start of a crash because you have the structural map to guide you. This clarity allows for more disciplined execution and better risk management. To start tracking these market degrees with us and access our full suite of analytical tools, you can Explore our Membership Plans today.
Understanding the structural hierarchy of the market is the difference between guessing and truly analyzing. We have seen how wave degrees act as a blueprint, helping you navigate from multi-century cycles down to the smallest intraday movements. By maintaining consistent labels and avoiding the psychological trap of mixing timeframes, you gain a clear view of price action. Having an Elliott Wave degree explained in this structured way is the first step toward professional-grade analysis.
The path to mastery doesn’t have to be a solo journey. At Wavetraders, we bring over 20 years of market analysis expertise to help you transition from theory to real-time execution. Our members gain access to live chart examples, comprehensive video lessons, and our proprietary Elliott Wave Calculator to ensure every count is mathematically sound. You can Master Wave Degrees in our Elliott Wave School and start tracking the markets with precision alongside a community of dedicated practitioners. With the right tools and a disciplined approach, you’ll find that even the most complex charts begin to reveal their underlying order.
For day traders, the Minute, Minuette, and Subminuette degrees are the most relevant. These cover the price action typically seen on 1-minute to 60-minute charts. However, you shouldn’t ignore the higher-degree trend. Even a perfect Subminuette setup can fail if it’s fighting against a Primary degree impulse.
You can identify patterns without Fibonacci, but your accuracy will likely suffer. This Elliott Wave degree explained guide emphasizes that degrees are relative measurements. Fibonacci ratios provide the objective evidence needed to confirm if a wave is proportional to the others in its degree. Without these numbers, labeling becomes much more subjective.
There are nine standard degrees recognized in the classic methodology. These range from the centuries-long Grand Supercycle down to the minute-by-minute Subminuette. While some software allows for even more granular labels, these nine provide a comprehensive framework for almost any market, including modern cryptocurrencies and fast-moving FX pairs.
Analysts often differ because they may be starting their counts from different historical pivot points. One practitioner might see a move as a Cycle degree correction, while another views it as a Primary degree wave four. This usually happens when the internal structure of the wave is complex or when the analyst lacks higher-degree context.
There isn’t a mandatory universal color-coding system for degrees. Most professional platforms allow you to customize your labels to suit your visual preference. The key is to develop a personal standard and stick to it; if you are looking for the best charting software to manage this, Alternative Radar is a helpful resource for discovering and comparing alternatives to popular digital tools. Consistency helps you recognize patterns quickly without having to re-read your legend every time you open a new chart.
If a lower-degree wave violates a core rule, the higher-degree count is automatically invalidated. The fractal nature of the market means that the integrity of the whole depends on the integrity of its parts. You must re-evaluate your labels from the top down to find where the logic broke and adjust your count accordingly.
Distinguishing between these two depends on the duration and price magnitude of the move. A Primary trend typically lasts several months to a few years and is clearly visible on a weekly chart. An Intermediate trend sits within that Primary move, usually defining the swings you see on a daily chart over several weeks or months.
Every five-wave sequence must belong to a specific degree because the market is a continuous fractal. A move doesn’t exist in isolation. It’s always either the full motive phase of its own degree or a sub-component of a wave at the next higher degree. This hierarchy is what makes the theory such a complete mapping tool.
DISCLAIMER
Any reviews, news, analysis, prices or other information contained on our website is provided as general market commentary and delivered electronically through a distribution channel to larger number of clients, therefore does not constitute investment advice or investment research. We are not trading advisors. Most of our work is for educational purposes only, with information based on Elliott Wave theory in real time. Trading forex, futures, options, stocks, cryptocurrenices or any another trading market carries a high level of risk, and may not be suitable for all investors.
The possibility exists that you could lose some or all of your initial investment; therefore you should not invest money that you cannot afford to lose. Our website and the information that we provide should not be relied upon as a substitute for extensive independent research before making your investment decisions. In no event will we be liable for any loss or damage on your account in connection with, the use of our products. For any real cash investments you have to contact your financial advisor.
Any information or material contained on our website is owned by Val Global d.o.o.. Reproduction is prohibited without Val Global d.o.o. prior license in writing.
By continuing to use the site, you agree to the use of cookies. Learn more.
The cookie settings on this website are set to "allow cookies" to give you the best browsing experience possible. If you continue to use this website without changing your cookie settings or you click "Accept" below then you are consenting to this.